
UV Spectroscopy Market Summary:
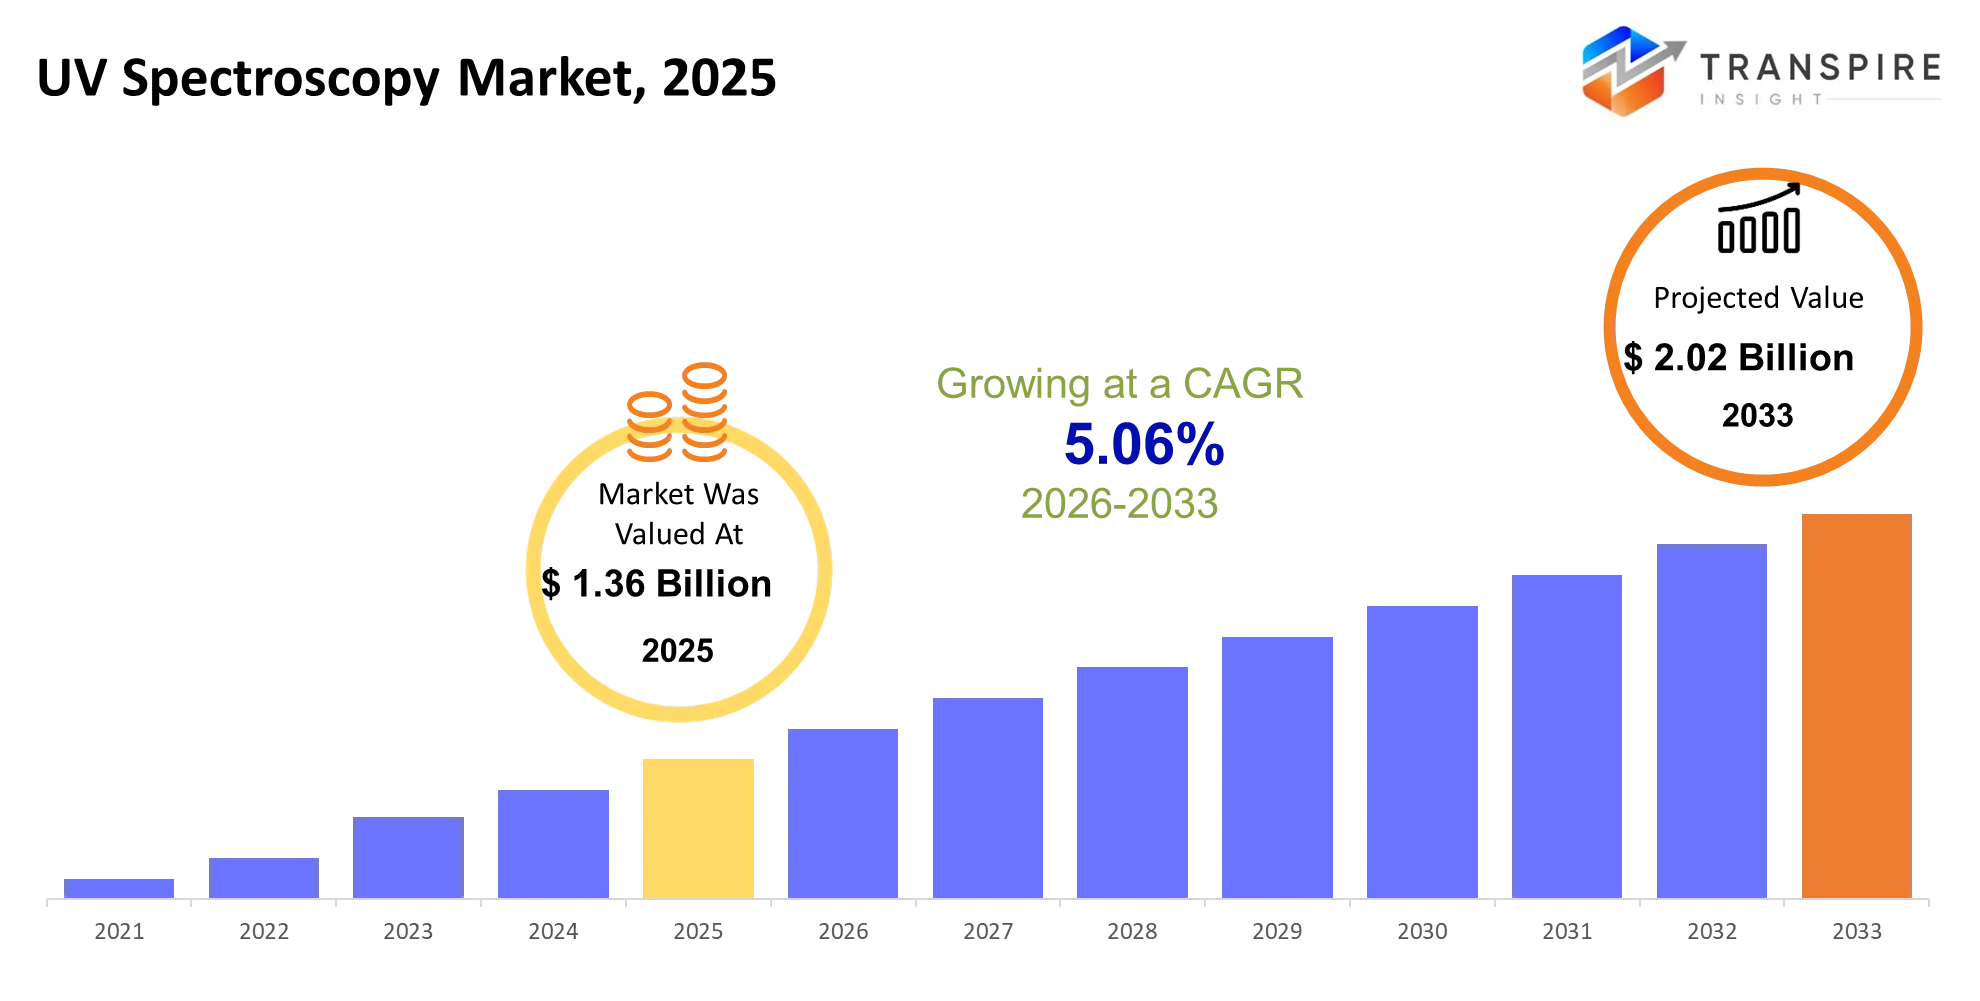
As per Transpire Insight, The UV Spectroscopy Market size is estimated at USD 1.36 billion in 2025 and is anticipated to reach USD 2.02 billion by 2033, growing at a CAGR of 5.06% from 2026 to 2033.
The ultraviolet spectroscopy market allows labs and manufacturing plants to identify, quantify, and monitor compounds by measuring their absorption of UV and visible light. The technique is used to evaluate drug purity, DNA and protein concentration, water contamination, food additives, and chemical-process consistency. In the last 3-5 years, the market has moved from standalone benchtop instruments towards small, connected and automated instruments integrated into laboratory workflows. Microvolume and fibre-optic options are a disruptive innovation in this space, where sample volumes are lowered, and in-line measurement is enabled. A real-world catalyst for this market evolution has been the growth of biologics, gene therapies, and mRNA-based manufacturing, where rapid measurement of nucleic-acid and protein quality is essential. This has led instrument manufacturers to adopt automated sampling, digital audit trails, and cloud-enabled software. Adoption has accelerated, as laboratories can obtain decision-ready results more quickly, with less sample, less reagent, and less labour.
UV Spectroscopy Market Size & Forecast:
- Market Size 2025: USD 1.36 Billion
- Expected Market Value (2033): USD 2.02 Billion
- Forecast CAGR (2026–2033): 5.06%
- Leading Region in 2025: North America
- Fastest Growing Region: Asia Pacific
- Key Company Profiles: Agilent Technologies, Thermo Fisher Scientific, Shimadzu, PerkinElmer, JASCO, Hach, HORIBA, Bio-Rad Laboratories, Analytik Jena, Hitachi High-Tech, METTLER TOLEDO, Cole-Parmer, Ocean Insight, Edinburgh Instruments, Buck Scientific.
Key UV Spectroscopy Market Insights:
The market is heading towards application-specific instruments that integrate reliable optical measurement, automation, digital traceability, and lower sample consumption. The ability to integrate workflows and analytical performance is becoming more important than instrument specifications alone in achieving competitive advantage.
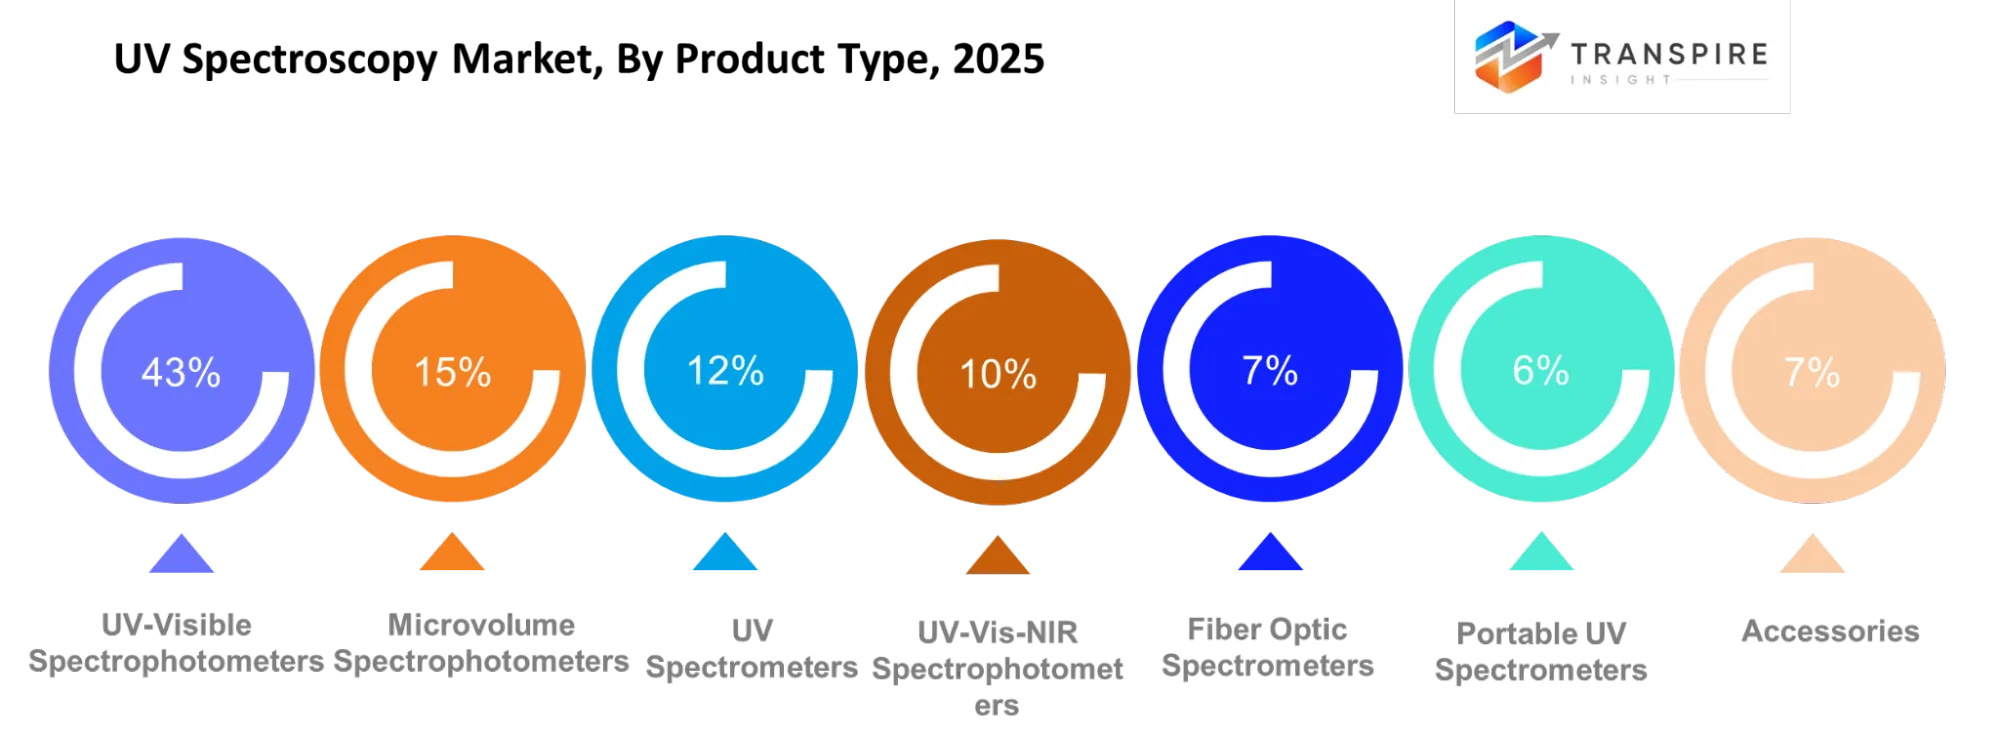
- The UV-Visible spectrophotometers account for 42.6% of the market, and the Cary 60 platform from Agilent also includes automated method development, temperature control, and an 18-cell changer for unattended workflows.
- Microvolume spectrophotometers represent 8.7% of the market, with growth rates of 15%, driven by Bio-Rad and Thermo Fisher focusing on low-sample nucleic-acid and protein quantification in genomics labs.
- The UV-1900i Plus from Shimadzu is the instrument that employs high-speed scanning and low stray-light optics for trace-level sensitivity, representing 12%.
- UV-Vis-NIR systems are used for 10% of all applications, with the Agilent Cary 7000 providing advanced transmittance measurement in material and optical-component research.
- Fibre-optic spectrometers add 7%, and Ocean Insight works on modular probes and miniaturised optics for embedded industrial and environmental sensors.
- Portable UV spectrometers account for 6%, and Hach and Cole-Parmer push field-ready water-quality and environmental testing out of central labs.
- Accessories account for 4% of the total; METTLER TOLEDO and PerkinElmer introduce new automated sampling, cuvettes, and flow cells to increase instrument uptime.
- HORIBA's acquisition of Tethys Instruments enhances its portfolio of in-line analytical and process-monitoring solutions.
- AI-powered chemometrics is rapidly moving the vendors from hardware sales to predictive, cloud-based analytical workflows.
What are the Key Drivers, Restraints, and Opportunities in the UV Spectroscopy Market?
Driver:
Pharmaceutical quality-control requirements and biopharmaceutical process monitoring are major growth drivers. The expansion of biologics, nucleic-acid therapies, and contract manufacturing has increased the need to quantify concentrations, verify purity, and monitor production stages consistently. UV-Vis instruments offer rapid measurements that help laboratories release batches efficiently and detect process deviations earlier. Regulatory expectations for validated analytical methods and reliable electronic records further encourage replacement of older systems with instruments offering automated checks and traceable results.
Restraint:
High acquisition, validation, and maintenance costs continue to limit uptake among small laboratories, academic facilities, and emerging-market testing providers. The constraint persists because regulated environments require instrument qualification, software validation, calibration records, and trained operators; these compliance costs often exceed the price of the instrument itself. Smaller users therefore delay replacement or choose lower-specification equipment, slowing premium-system penetration.
Opportunity:
Inline spectroscopy and miniaturised analytical platforms offer a route to wider adoption. Pharmaceutical manufacturers can integrate UV sensors into continuous processing to monitor concentration changes without repeatedly withdrawing samples for laboratory testing. In parallel, biotechnology laboratories can use microvolume instruments to conserve valuable DNA, RNA, and protein samples. Asia-Pacific presents an opportunity as pharmaceutical production, contract research, and laboratory infrastructure expand. Suppliers that combine compact optics, automated calibration, software connectivity, and regional servicing can address cost-sensitive buyers while generating recurring revenue from maintenance, accessories, and compliance-support services.
What Has the Impact of Artificial Intelligence Been on the UV Spectroscopy Market?
AI is elevating UV spectroscopy from a measurement tool to a decision-support platform. Machine-learning and chemometric models automate baseline correction, spectral interference removal, select analytical wavelengths, and deconvolute overlapping components in multicomponent matrices, minimising method development effort and operator-to-operator and instrument-to-instrument variation. Predictively, AI models can predict multi-component concentrations, detect process excursions and transfer calibration between instruments. Process analysers with inline UV-Vis coupled to an AI-based control system can provide operators with faster insights into instrument drifts or out-of-specification (OOS) trends than manual review of data, enabling corrections to temperature, flow, or formulation to be made in advance of spillage of a batch.
AI can also improve laboratory throughput by automating results review, detecting anomalous spectra and correlating outputs with laboratory information management systems (LIMS). Coming soon, foundation models for spectral simulation, inverse problems and structure elucidation may reduce the length of method development cycles. An accurate, generalisable AI model requires data that is large, representative, and labelled. Integrating AI models into legacy instruments and harmonising them with regulated quality systems and IT infrastructure can be cost-prohibitive. Additionally, where samples, matrices, or instrument conditions differ from the training set, model accuracy can deteriorate; therefore, lab validation is critical.
In August 2026, Wiley launched its first spectral analysis API portfolio. This deployment delivers trusted spectral data, predictive models, and analytical algorithms directly into laboratory workflows to accelerate substance identification.
Key UV Spectroscopy Market Trends:
UV spectroscopy is moving from individual analytical instruments to application-specific systems, which are connected to the process and feature digital traceability. In addition to optical performance, buyers are increasingly interested in workflow efficiency, sample preservation, and reliable results.
- Compact and portable systems are taking share as testing is increasingly being conducted closer to the production line, clinic and field sites, but the benchtop instruments are still the workhorse.
- In genomics and biologics research, microvolume platforms are taking the place of cuvette workflows, minimising sample waste in testing DNA, RNA and protein.
- Double-beam optics continue to be the dominant technology in the precision optics laboratory, and diode-array designs are increasing in popularity due to their ability to acquire the entire spectrum of light quickly.
- In-line monitoring of pharmaceutical, chemical, food and water processes is possible thanks to fibre-optic probes and flow cells.
- Laboratories are increasingly incorporating UV-Vis instruments into their laboratory information systems, electronic records and automated sampling to enhance traceability.
- Chemometrics is evolving from manual peak reading to pattern recognition and multicomponent quantification by using AI.
- Rapid, low-volume purity and concentration testing is becoming more in demand for biologics and nucleic-acid manufacturing.
- The market is growing with more customers than just central laboratories, as point-of-care diagnostics and on-site environmental testing gain traction.
- Vendors are battling it out on software, compliance tools, connectivity, and service models, not just on optical hardware.
UV Spectroscopy Market Segmentation
By Product Type:
UV-Visible Spectrophotometers dominate the product segment with a 42.6% share, supported by their versatility in pharmaceutical testing, chemical analysis, and routine quality control. Microvolume Spectrophotometers account for 15% and are projected to grow at an 8.7% CAGR, driven by biotechnology research and the need to conserve valuable samples. UV Spectrometers hold 12%, followed by UV-Vis-NIR Spectrophotometers at 10%, Fibre Optic Spectrometers at 7%, and Portable UV Spectrometers at 6%. Accessories contribute 4%, while other products account for 3.4%. This mix reflects sustained demand for established laboratory instruments alongside specialised, compact, and application-focused analytical solutions.
By Technology:
Single-beam systems remain suitable for cost-conscious laboratories conducting routine absorbance measurements, while double-beam instruments support reference correction and improved measurement stability. Array-based and diode-array technologies enable rapid spectral acquisition, making them useful for laboratories processing multiple samples under tight timelines. Scanning systems provide detailed wavelength-by-wavelength analysis for applications requiring controlled spectral resolution. Fourier Transform technology supports specialised analytical workflows, while hybrid and other configurations address application-specific performance requirements. Future adoption will depend on balancing instrument cost, measurement precision, throughput, and compatibility with automated laboratory systems.
By Application:
Pharmaceutical applications rely on UV spectroscopy to assess drug concentration, dissolution, raw-material quality, and formulation consistency. Biotechnology laboratories use absorbance measurements to quantify nucleic acids and proteins during research and development. Environmental testing applies UV-based methods to water-quality monitoring and selected contaminant measurements. Food and beverage producers use spectroscopy for composition checks and quality assessment, while chemical manufacturers monitor concentrations and verify formulations. Clinical diagnostics, academic research, and other applications broaden utilisation across scientific settings. Demand will increasingly favour instruments that deliver reproducible results, faster analysis, and straightforward digital reporting.
By Sample Type:
Liquid samples are widely used because they can be analysed through established absorbance procedures with relatively straightforward preparation. Solid and powdered materials may require dissolution, extraction, or specialised sample-handling accessories before measurement. Gas analysis requires suitable optical cells and configurations designed for the target compounds. Biological samples, including DNA, RNA, and proteins, benefit from methods that minimise sample consumption and maintain analytical integrity. Environmental and pharmaceutical samples require preparation appropriate to their composition and testing objectives. Other sample types create demand for adaptable instrument configurations, reliable calibration, and validated analytical methods across laboratory and industrial applications.
By End User:
Pharmaceutical companies prioritise UV spectroscopy for quality control, formulation testing, and consistent batch assessment. Biotechnology companies use these instruments to quantify biological materials while supporting research and development workflows. Research institutes depend on spectral measurements for experimental analysis, whereas hospitals and testing laboratories apply suitable methods to clinical research and specialised testing. Food manufacturers use spectroscopy for selected composition and quality checks, while chemical companies monitor concentrations and verify production materials. Other end users adopt systems according to their analytical requirements and budgets. Future purchasing decisions will increasingly reflect automation, service availability, software compatibility, and the need for repeatable measurements.
By Wavelength:
Ultraviolet wavelengths support measurements of compounds with characteristic UV absorption, while visible wavelengths are useful for analysing coloured substances and selected chemical reactions. UV-visible systems combine both ranges, providing versatility across pharmaceutical, chemical, and research applications. UV-NIR instruments extend measurement capabilities towards near-infrared wavelengths for broader material characterisation. Deep UV and near UV configurations address specialised absorption characteristics, although their suitability depends on optical components, sample properties, and method requirements. Extended UV and other wavelength configurations serve more specific analytical needs. Future development will focus on wavelength flexibility, detector sensitivity, measurement stability, and matching instrument performance to the intended application.
By Distribution:
Direct sales remain important for complex laboratory installations requiring application consultation, instrument configuration, staff training, and after-sales support. Distributors extend geographic reach and provide local access to equipment, consumables, and technical assistance. Online channels help buyers compare specifications, obtain quotations, and purchase standard accessories or entry-level instruments. Speciality suppliers serve laboratories with specific analytical requirements, while original equipment manufacturers integrate spectroscopy components into larger analytical systems. Laboratory suppliers and retail channels address varied procurement needs. As purchasing becomes more digitally enabled, suppliers will need to combine convenient ordering with dependable installation, calibration, maintenance, and technical support to strengthen customer retention and expand recurring revenue.
What are the Key Use Cases Driving the UV Spectroscopy Market?
The core use case is pharmaceutical quality control, aligned with the dominance of UV-Visible spectrophotometers at a 42.6% share. Manufacturers use these systems for assay strength, dissolution testing, impurity screening, and stability studies, where fast absorbance-based results support batch-release decisions.
Expanding applications include biotechnology and clinical research, where microvolume instruments quantify DNA, RNA, and proteins from minimal samples. Environmental laboratories also use UV-Vis systems for nitrate, phosphate, organic contaminants, and water-quality monitoring, while food producers apply them to colour, additive, and authenticity testing.researchandmarkets+1
Emerging use cases centre on in-line process analytics. Fibre-optic UV-Vis probes and AI-supported chemometrics are being deployed in continuous pharmaceutical manufacturing, chemical production, and water-treatment plants to detect concentration changes and process deviations in real time.
|
Report Metrics |
Details |
|
Market size value in 2025 |
USD 1.36 Billion |
|
Market size value in 2026 |
USD 1.43 Billion |
|
Revenue forecast in 2033 |
USD 2.02 Billion |
|
Growth rate |
CAGR of 5.06% from 2026 to 2033 |
|
Base year |
2025 |
|
Historical data |
2021 - 2024 |
|
Forecast period |
2026 - 2033 |
|
Report coverage |
Revenue forecast, competitive landscape, growth factors, and trends |
|
Regional scope |
United States; Canada; Mexico; United Kingdom; Germany; France; Italy; Spain; Denmark; Sweden; Norway; China; Japan; India; Australia; South Korea; Thailand; Brazil; Argentina; South Africa; Saudi Arabia; United Arab Emirates |
|
Key companies profiled |
Agilent Technologies, Thermo Fisher Scientific, Shimadzu, PerkinElmer, JASCO, Hach, HORIBA, Bio-Rad Laboratories, Analytik Jena, Hitachi High-Tech, METTLER TOLEDO, Cole-Parmer, Ocean Insight, Edinburgh Instruments, Buck Scientific. |
|
Customization scope |
Free report customization (country, regional & segment scope). Available customised purchase options to meet your exact research needs. |
|
Report Segmentation |
By Product Type (UV-Visible Spectrophotometers, Microvolume Spectrophotometers, UV Spectrometers, UV-Vis-NIR Spectrophotometers, Fiber Optic Spectrometers, Portable UV Spectrometers, Accessories, Others); By Technology (Single-beam, Double-beam, Array-based, Scanning, Diode-array, Fourier Transform, Hybrid, Others); By Application (Pharmaceuticals, Biotechnology, Environmental Testing, Food & Beverage, Chemical Analysis, Clinical Diagnostics, Academic Research, Others); By Sample Type (Liquids, Solids, Powders, Gases, Biological Samples, Environmental Samples, Pharmaceutical Samples, Others); By End User (Pharmaceutical Companies, Biotechnology Companies, Research Institutes, Hospitals, Testing Laboratories, Food Manufacturers, Chemical Companies, Others); By Wavelength (UV, Visible, UV-Visible, UV-NIR, Deep UV, Near UV, Extended UV, Others); By Distribution (Direct Sales, Distributors, Online, Specialty Suppliers, OEM, Laboratory Suppliers, Retail, Others). |
Which Regions are Driving the UV Spectroscopy Market Growth?
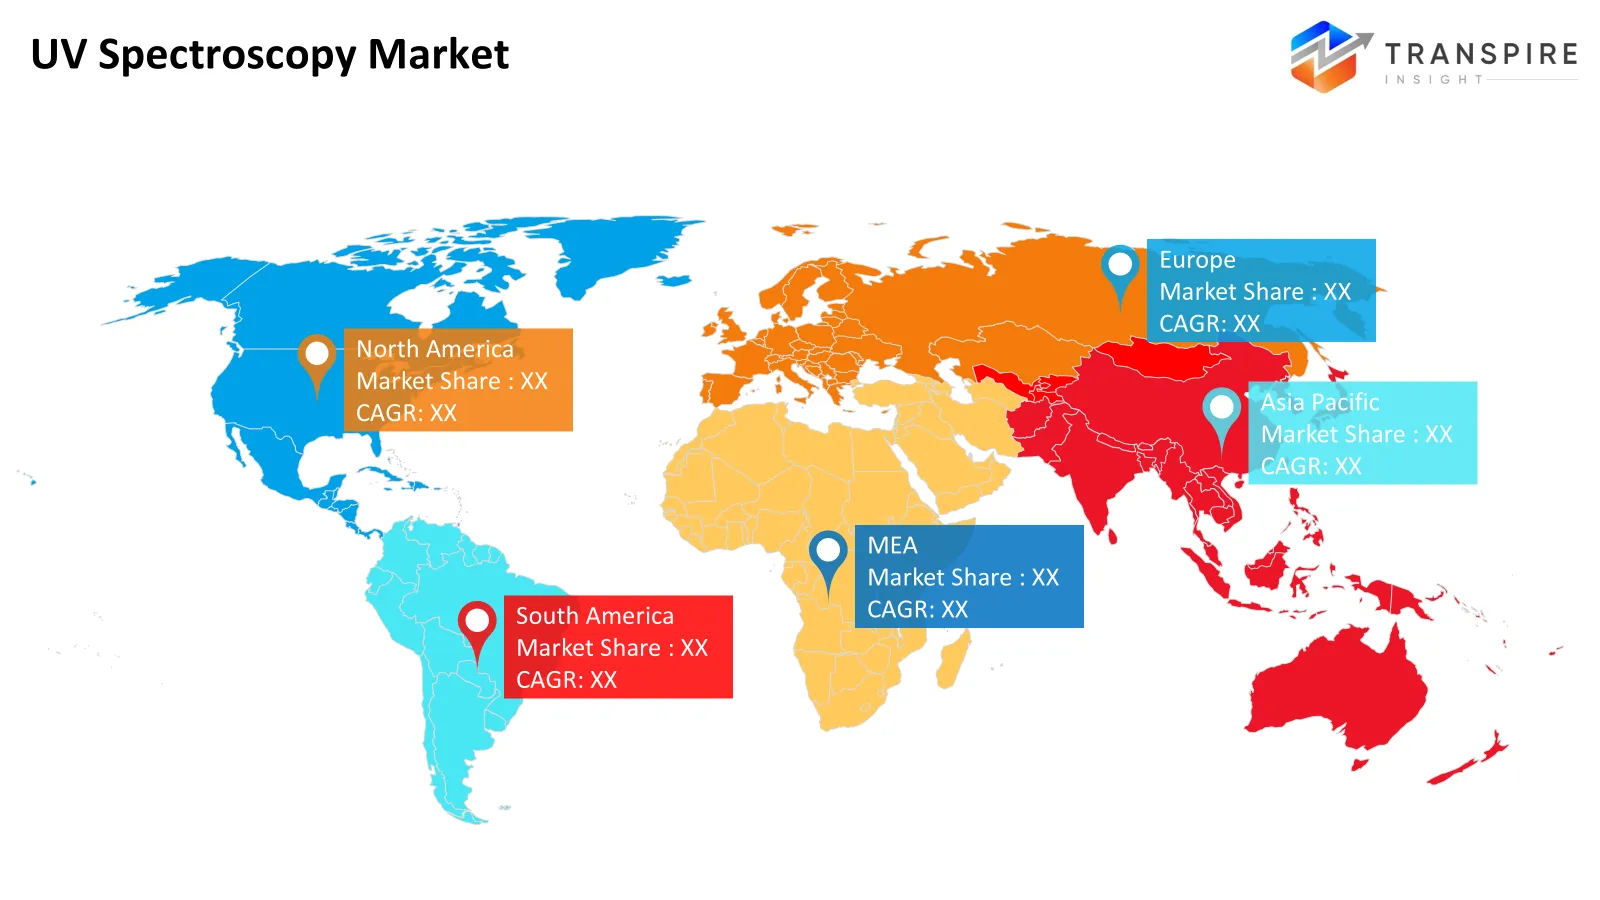
North America accounts for a large share of the market, 36.4%, owing to a highly developed integration of pharmaceutical, biotech, clinical research, and environmental testing industries, meeting rigorous government standards for validated analytical methods. North America is also benefiting from the well-established laboratory infrastructure and research funds awarded by the National Institutes of Health and the National Science Foundation, as well as the use of revolutionised automated, software-enabled instruments globally, besides early adoption of robust vendors, service providers, and quality control in biologics manufacturing.
In October 2026, Charles River Laboratories and Autolomous launched Apollo Orchestrate. This software capability integrates Autolomous' autoloMATE digital Laboratory Execution System into Charles River's existing platform to fully digitise GMP quality control testing and coordinate laboratory workflows across North American sites.
Europe holds 28% market share by emphasising large, standardised, compliance-oriented laboratories. Contact with pharmacopoeia-instrument specifications, environmental and food-safety controls, and a high concentration of academic and industrial research reinforces a steady replacement demand. Europe grows more as a result of instrument upgrades, sustainability-related water monitoring, and precision manufacturing than the opening of new laboratories.
In March 2026, the European Commission launched TraceMap, an AI platform designed for national authorities to detect food fraud and trace contamination. This tool significantly strengthens compliance-driven food security controls and accelerates product recall timelines across all EU member states.
Asia Pacific is the fastest-growing region, at 8.9% CAGR, and makes up 24% of demand. The recent growth in manufacturing facilities, bioscience parks, testing labs, and environmental monitoring programs in China, India, Japan, and South Korea is leading to an uptick in new instrument purchases and more demand for local service. Public sector investment in lab capacity and more affordable manufacturing creates an opportunity for smaller, more affordable, connected UV-Vis systems. Latin America makes up 6% of demand; the Middle East and Africa at 5.6%, with these regions showing long-term potential as testing capacity builds.
In September 2026, Agilent Technologies launched a new suite of advanced laboratory solutions in India, featuring the Agilent 9500 Triple Quadrupole ICP-MS and updated gas chromatography platforms with digital workflow features.
https://www.pharmabiz.com/NewsDetails.aspx?aid=188369&sid=2
Who are the Key Players in the UV Spectroscopy Market, and how do they compete?
Competition is shifting from only optical performance to workflow productivity, regulation, connectivity, and service-based recurring revenue. Vendors with established premium accounts are protecting premium accounts with validated instruments and extensive application support. Niche specialists are protecting their market with modularity, field commissioning, or application-specific sensing.
Agilent is pursuing an innovation-driven differentiation strategy, with Cary platforms, automated sampling software, and application know-how, and is seeking to expand by leveraging opportunities in pharmaceuticals and materials science. Thermo Fisher is leveraging broad laboratory distribution with integrated informatics to expand in high-throughput biopharmaceutical and clinical laboratories. Shimadzu is competitive based on accuracy, sensitivity, and pharmacopoeia compliance with high-speed scanning and low-noise optics in regulated quality-control laboratories. Perkin Elmer, JASCO, Hitachi High-Tech, and Analytik Jena are pursuing research, fluorescence-adjacent workflows and application-specific configurations. HORIBA and Ocean Insight differentiate by modularity and in-line sensing with fibre-optic probes, miniaturised optics and process integration. HORIBA's recent acquisition of Tethys reinforces its portfolio of analytical chemistry solutions. Hach, METTLER TOLEDO, Cole-Parmer, Bio-Rad, Edinburgh Instruments and Buck Scientific are pursuing water, automation, life-sciences quantification and value instruments via distribution, consumables and vertical solutions.
Key Players are:
- Agilent Technologies
- Thermo Fisher Scientific
- Shimadzu
- PerkinElmer
- JASCO
- Hach
- HORIBA
- Bio-Rad Laboratories
- Analytik Jena
- Hitachi High-Tech
- METTLER TOLEDO
- Cole-Parmer
- Ocean Insight
- Edinburgh Instruments
- Buck Scientific
Recent Development News
- In July 2026, Hach launched the DR4900 next-generation spectrophotometer, incorporating a 10-inch touchscreen and built-in temperature and turbidity diagnostics to improve measurement reliability, reduce common testing errors, and streamline water-quality analysis in municipal and industrial laboratories. https://www.prnewswire.com/in/news-releases/hach-launches-next-generation-dr4900-spectrophotometer-setting-a-new-industry-standard-for-fast-error-free-water-analysis-302818466.html
- In October 2026, X-Rite Pantone launched the Spectura Series, a new generation of connected portable spectrophotometers. This commercial release directly integrates colour measurement workflows from initial laboratory research into scaled enterprise manufacturing and production environments. https://www.prnewswire.com/news-releases/x-rite-pantone-launches-spectura-to-advance-connected-color-quality-from-lab-to-production-302895374.html
- In September 2026, Edinburgh Analytical and Alontia A/S launched the DB30 NanoIndex and DB30 NanoSize packages through a strategic partnership, combining UV-Vis spectroscopy with nanophotonic cuvettes and cloud analytics to enable refractive-index and particle-size analysis, reduce sample-volume requirements, and expand laboratory testing capabilities. http://azom.com/news.aspx?newsID=65842
What Strategic Insights Define the Future of the UV Spectroscopy Market?
The industry is shifting to embedded, in-line UV-Vis analytics that replace discrete lab results with constantly available process and quality data. This shifts value and purchasing power to vendors capable of integrating optics with software, chemometrics, connected instrumentation, and compliance-focused data management platforms. A second common example is the fragility of a data model, as AI and chemometric models can be fragile when sample matrices, operating conditions, and calibration sets differ from deployment. This type of risk to regulators and reputation comes with pharma and water QMS instrumentation. A new untapped revenue opportunity for vendors involves subscription analytical intelligence services that package instruments, probes, calibration intervals, data annotation and remote AI expertise to pharma, water and food industry clients. Stay focused on validated AI workflows and standards for interoperable data, while considering new revenue streams and sales channels in APAC to avoid reliance on one-time instrumentation sales, at an 8.9% CAGR.
Key Segmentations are:
By Product Type
- UV-Visible Spectrophotometers
- Microvolume Spectrophotometers
- UV Spectrometers
- UV-Vis-NIR Spectrophotometers
- Fibre Optic Spectrometers
- Portable UV Spectrometers
- Accessories
- Others
By Technology
- Single-beam
- Double-beam
- Array-based
- Scanning
- Diode-array
- Fourier Transform
- Hybrid
- Others
By Application
- Pharmaceuticals
- Biotechnology
- Environmental Testing
- Food & Beverage
- Chemical Analysis
- Clinical Diagnostics
- Academic Research
- Others
By Sample Type
- Liquids
- Solids
- Powders
- Gases
- Biological Samples
- Environmental Samples
- Pharmaceutical Samples
- Others
By End User
- Pharmaceutical Companies
- Biotechnology Companies
- Research Institutes
- Hospitals
- Testing Laboratories
- Food Manufacturers
- Chemical Companies
- Others
By Wavelength
- UV
- Visible
- UV-Visible
- UV-NIR
- Deep UV
- Near UV
- Extended UV
- Others
By Distribution
- Direct Sales
- Distributors
- Online
- Speciality Suppliers
- OEM
- Laboratory Suppliers
- Retail
- Others
By Regional Analysis
North America
- US
- Canada
- Mexico
Europe
- Germany
- UK
- France
- Italy
- Spain
- Russia
- Rest of Europe
Asia Pacific
- China
- Japan
- India
- South Korea
- Australia
- Rest of Asia Pacific
South America
- Brazil
- Argentina
- Rest of South America
Middle East & Africa
- UAE
- Saudi Arabia
- Qatar
- South Africa
- Rest of the Middle East & Africa
Frequently Asked Questions
Find quick answers to common questions.
The UV spectroscopy market size was valued at USD 1.36 billion in 2025 and is poised to reach USD 2.02 billion by 2033, expanding at a 5.06% CAGR.
Key segments for the UV spectroscopy market are By Product Type (UV-Visible Spectrophotometers, Microvolume Spectrophotometers, UV Spectrometers, UV-Vis-NIR Spectrophotometers, Fiber Optic Spectrometers, Portable UV Spectrometers, Accessories, Others); By Technology (Single-beam, Double-beam, Array-based, Scanning, Diode-array, Fourier Transform, Hybrid, Others); By Application (Pharmaceuticals, Biotechnology, Environmental Testing, Food & Beverage, Chemical Analysis, Clinical Diagnostics, Academic Research, Others); By Sample Type (Liquids, Solids, Powders, Gases, Biological Samples, Environmental Samples, Pharmaceutical Samples, Others); By End User (Pharmaceutical Companies, Biotechnology Companies, Research Institutes, Hospitals, Testing Laboratories, Food Manufacturers, Chemical Companies, Others); By Wavelength (UV, Visible, UV-Visible, UV-NIR, Deep UV, Near UV, Extended UV, Others); By Distribution (Direct Sales, Distributors, Online, Specialty Suppliers, OEM, Laboratory Suppliers, Retail, Others).
Growth is primarily driven by expanding pharmaceutical quality-control requirements, increasing biotechnology research, stricter analytical testing standards, demand for rapid concentration and purity measurements, and the adoption of automated, microvolume, and digitally connected spectroscopy systems.
The UV spectroscopy market is led by major manufacturers, including Agilent Technologies, Thermo Fisher Scientific, Shimadzu, PerkinElmer, JASCO, Hach, HORIBA, Bio-Rad Laboratories, Analytik Jena, Hitachi High-Tech, METTLER TOLEDO, Cole-Parmer, Ocean Insight, Edinburgh Instruments, and Buck Scientific.
North America accounts for 36.4% of the UV spectroscopy market, supported by advanced pharmaceutical and biotechnology research, established laboratory infrastructure, strong analytical testing capabilities, and sustained investment in drug development and quality control.
Commercial opportunities lie in microvolume instruments, AI-assisted spectral analysis, inline pharmaceutical monitoring, portable testing systems, and expanding laboratory infrastructure across Asia Pacific.
- Agilent Technologies
- Thermo Fisher Scientific
- Shimadzu
- PerkinElmer
- JASCO
- Hach
- HORIBA
- Bio-Rad Laboratories
- Analytik Jena
- Hitachi High-Tech
- METTLER TOLEDO
- Cole-Parmer
- Ocean Insight
- Edinburgh Instruments
- Buck Scientific
About the Authors

Pankaj Ghogare Patil
I am Pankaj Ghogare Patil, a Senior Research Analyst at Transpire Insight, specializing in the Pharmaceutical, Chemicals & Materials, Healthcare IT, and Biotechnology industry. My expertise lies in conducting comprehensive market research, analyzing industry trends, evaluating competitive landscapes, and translating complex data into actionable insights. At Transpire Insight, I closely follow emerging technologies, regulatory developments, and market innovations to create accurate, well-researched, and informative content that helps businesses and professionals make informed decisions. I am committed to producing credible, evidence-based articles that reflect industry best practices while making technical topics accessible and valuable for a broad audience.

Chakradhar Khansole
Chakradhar serves as the Research Director at Transpire Insight, bringing over 8 years of experience in technology, innovation, and strategic market intelligence. He specializes in transforming complex market data into actionable business insights that enable organizations to make informed, growth-oriented decisions. Recognized for his strategic vision and analytical expertise, Chakradhar leads high-impact research initiatives, delivering comprehensive market assessments, competitive intelligence, and forward-looking industry analysis.
Recently Published Reports
-
Apr 2026
AI in Diabetic Retinopathy Market
AI in Diabetic Retinopathy Market Size, Share & Analysis Report By Type (Screening AI Systems, Diagnostic AI Systems, and Predictive AI Models), By Application Segment (Hospitals, Ophthalmology Clinics, Diagnostic Centers, and Research and Development), and Geography (North America, Europe, Asia-Pacific, Middle East and Africa, South and Central America), 2021 - 2031
-
Apr 2026
Psychometric Tests Market
Psychometric Tests Market Size, Share & Analysis Report By Type (Personality Tests, Ability/Aptitude Tests, Skill/Knowledge Tests, and Others), By Application (Talent Acquisition and Talent Management), and Geography (North America, Europe, Asia-Pacific, Middle East and Africa, South and Central America), 2021 – 2031
-
Apr 2026
Rare Biological Sample Collection Market
Rare Biological Sample Collection Market Size, Share & Analysis Report By Type (Isolation Kits & Reagent, Blood Collection Tubes, and Others), By Application (Oncology, Transcriptomics, Pharmacogenomics, and Others), and Geography (North America, Europe, Asia-Pacific, Middle East and Africa, South and Central America), 2021 – 2031
-
Jul 2026
Diabetic Retinopathy Market
Diabetic Retinopathy Market Size, Share & Analysis Report By Type (Proliferative Diabetic Retinopathy, and Diabetic Macular Edema (DME)), By Treatment Type (Anti VEGF Drug, Steroid Implants, Laser Surgeries, and Vitrectomy), and Geography (North America, Europe, Asia-Pacific, Middle East and Africa, South and Central America), 2021 – 2031
Our Clients