
North America PET Scanners Market Size & Forecast
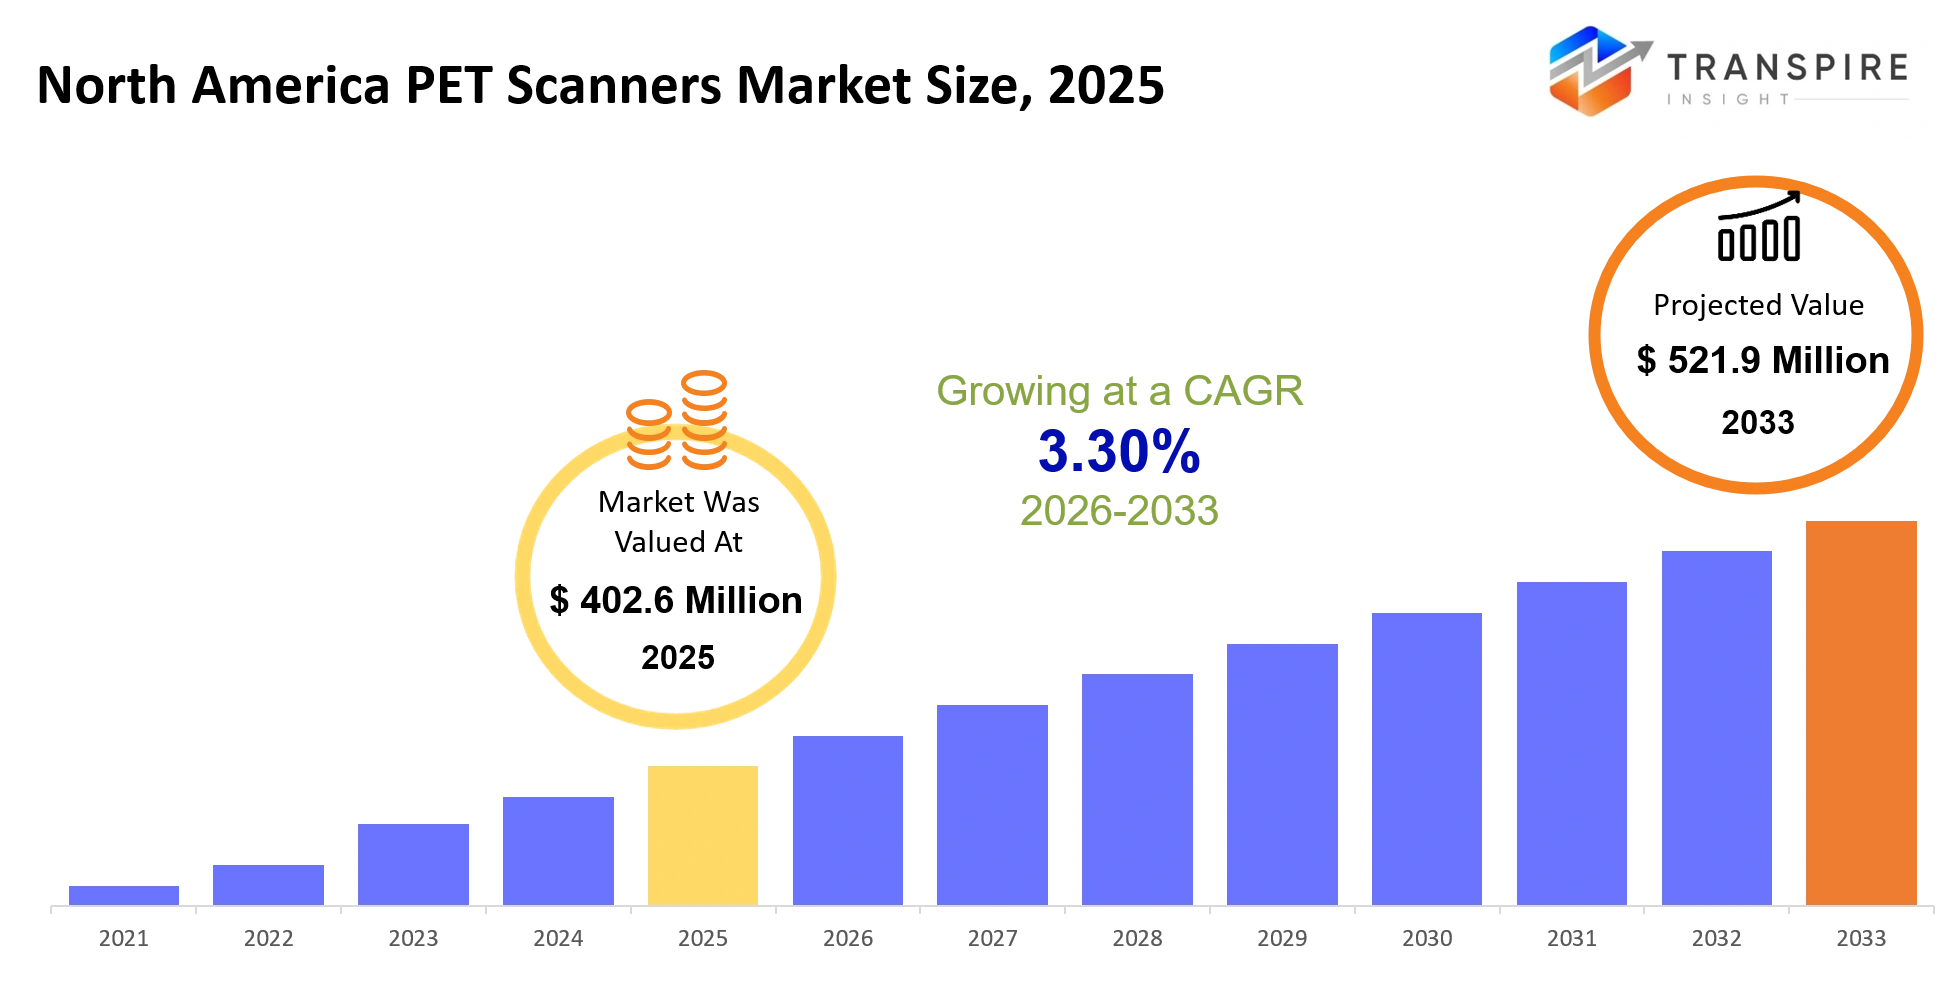
- North America PET Scanners Market Size 2025: USD 402.6 Million
- North America PET Scanners Market Size 2033: USD 521.9 Million
- North America PET Scanners Market CAGR: 3.30%
- North America PET Scanners Market Segment: By Product Type (Full-Ring, Partial-Ring, Digital, PET/CT, PET/MRI, Mobile, Dedicated Brain), By Application (Oncology, Cardiology, Neurology, Drug Development, Infection, Research, Precision Medicine), By Detector Type (Digital, Analog, Silicon Photomultipliers, Scintillation, Hybrid, High-Sensitivity, AI-Enhanced), By End User (Hospitals, Diagnostic Centers, Academic Institutes, Research Centers, Cancer Centers, Specialty Clinics, Government, Others), By Portability (Fixed, Mobile, Compact, Hybrid, High-Resolution, Integrated, Multi-Modality).
North America PET Scanners Market Summary
Positron Emission Tomography (PET) systems kind of “see” metabolic activity at the cellular level, using positron-emit ting radiopharmaceuticals. In day to day clinical practice, PET scanners help clinicians find tumors, track treatment response, and spot neurological disease before structural changes show up on more conventional imaging. The North American market was valued around USD 402.6 Million in 2025, and it’s forecast to climb to USD 521.9 Million by 2033, with a CAGR of 3.30%
Over the last 3-5 years, there’s been a real shift in PET image building and interpretation methods, mostly by threading in artificial intelligence. Deep learning driven iterative reconstruction approaches have reduced the radiation needed for scans by as much as 40% , and at the same time they tend to deliver crisper images than the older filtered back projection methods. Because of that, purchasing decisions at hospitals and imaging centers are getting influenced a lot: lower-dose scan plans don’t just satisfy radiation safety rules, they also match what many patients want , which is minimal exposure.
And a rather concrete turning point sped up adoption: when the FDA and Medicare recognized the value of blood-based biomarkers for diagnosing Alzheimer’s disease, via testing. With phosphorylated tau and amyloid-beta serum tests becoming covered options (along with PET scanning) for cognitive evaluation in 2023 and 2024, some primary care physicians started picking these non-PET routes more often. Still, neurologists and radiologists pushing back against cost driven rationing helped spark a sort of rebound, there’s been extra demand for high-definition, specialized brain PET scanners, the kind that offer noticeably higher diagnostic precision. So the market now looks split, where super advanced imaging features pull in premium pricing, while more standard PET/CT systems are dealing with thinner profit margins.
Key North America PET Scanners Market Insights
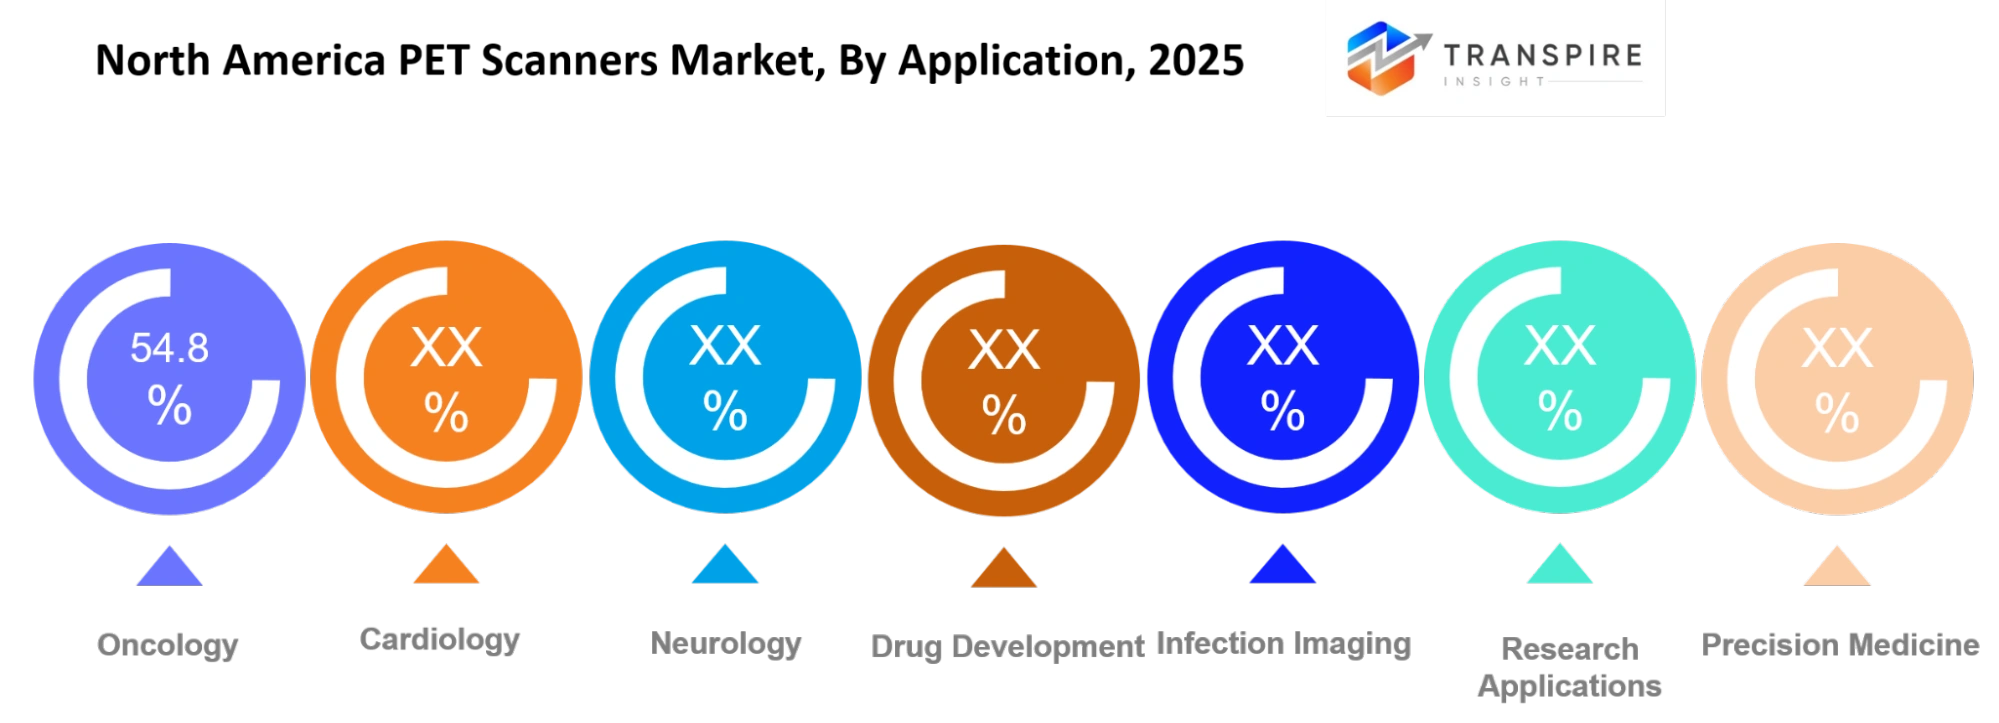
- Oncology imaging will account for 54. 8 percent of North America’s PET scanner revenue in 2025—mostly because the routine screening protocols keep getting used in big cancer centers, and also because precision oncology decision support is becoming even more widespread.
- PET/CT systems are still kind of the king of the product type segment, at about 68 percent of the market’s revenue, since integrated dual modality platforms have really turned into the clinical standard for oncologic staging, and restaging by itself.
- Digital detector PET scanners are the fastest-growing group, they’re projected to expand at a CAGR above 6 percent through 2033, as manufacturers start swapping out analog photomultiplier tube architecture with solid state digital photodetector systems themselves.
- Hospitals and very large cancer centers make up more than 60 percent of PET scanner installations in North America, which basically underlines the huge capital cost barrier. That barrier really limits adoption to high volume medical institutions on their own.
- GE HealthCare and Siemens Healthineers together hold around 55 percent of the North American PET scanner market, largely due to their ongoing connections with major healthcare networks, and also because they have pretty strong service infrastructure internally.
- Mobile and compact PET systems are growing at above 8 percent each year, as smaller regional medical centers, and specialty clinics want to offer PET imaging services without having to spend millions on permanent installations.
- FDA regulatory approvals for new radiopharmaceuticals, especially tau imaging agents for Alzheimer’s disease, are actually closely tied to local increases in PET scanner utilization, and to replacement demand too.
What are the Key Drivers, Restraints, and Opportunities in the North America PET Scanners Market?
The main driver here is the precision oncology movement, where molecular imaging kind of helps in choosing your treatment and also monitoring how you are responding in real-time. Patients with non-small-cell lung cancer , metastatic breast cancer, and colorectal cancer are getting PET imaging more often right away, to figure out if there are any targetable mutations and to start combining therapies. This initial imaging requirement really sets up a baseline procurement demand that stays pretty steady even when economic conditions wobble. The second driver is spotting diseases early, especially neurodegenerative diseases. The FDA approved a handful of anti-amyloid monoclonal antibodies for Alzheimer’s in 2023 and 2024 , and that creates even more demand for PET imaging to confirm amyloid-related issues before starting those extremely expensive disease-altering treatments. That direct link between treatment access and hospital demand for specialized brain PET systems , makes it pretty clear.
The biggest restraint we see is reimbursement uncertainty. PET imaging codes get reclassified and reviewed for coverage limitations quite often by Medicare and also private insurance. So whenever a PET scan indication loses its reimbursement status , or it gets pushed into prior authorization requirements, imaging volumes drop sharply at those facilities. That in turn further delays equipment upgrades. Overall, this really creates purchasing uncertainty that messes with long-term capital planning at the facility level. What’s more, the capital costs of PET/CT systems are well over $2 million per installation, so you’re looking at a massive upfront spend that many mid-sized hospitals just can’t absorb without outside funding, which severely trims our addressable market to highly capitalized academic centers and large community hospital systems.
We think the clearest chance is to commercialize way smaller, more mobile PET systems - so imaging becomes possible for regional health centers and specialty clinics, without having to find all that space and power backbone that comes with the usual fixed PET/CT setups. United Imaging Healthcare and Mediso both have rolled out movable, or semi-permanent PET platforms, which are sort of ideal for temporarily placing in outpatient oncology and neurology locations. And as regional health systems keep pushing their specialty care services beyond the big academic hubs, the need for decentralized PET capacity will likely grow faster than the traditional, hospital-bound offerings. Our second opportunity is to fold PET scanners into hybrid platforms that mix PET with newer adjunct technologies like high resolution ultrasound or optical coherence tomography. That could generate genuinely distinctive diagnostic options, which typically command higher reimbursements and win more market share.
What Has the Impact of Artificial Intelligence Been on the North America PET Scanners Market?
Artificial intelligence really changes PET imaging in a few practical ways, kind of like a practical shift rather than just a research idea. First there is iterative image reconstruction, then some help for diagnostic interpretation, and finally streamlining of the whole workflow. Iterative reconstruction approaches that use deep neural networks can ingest patterns from many thousands of real clinical PET datasets, and after that they apply those learned representations to brand new patient scans. In practice this can cut radiation dosage by something like 30 to 40 percent, while still keeping the image quality at least the same, or even making it better than traditional filtered back projection. So the reduction isnt just a small tweak, it can actually transform PET imaging, pushing it into patient groups that were once considered too young or otherwise not a good fit for radiation exposure, and that in turn expands the clinical indications plus the screening populations that may safely receive imaging.
For interpretation, AI systems trained on annotated PET imaging collections can detect lesion characteristics, estimate cancer likelihood, and highlight possible findings that clinicians might miss when the scans are highly complicated multi-organ cases. Also, Siemens and GE have put AI driven interpretation modules right into their PET/CT systems so radiologists get a decision support tool not an autonomous diagnostic replacement. Early clinical results suggest these kinds of tools can reduce interpretation time by around 15 to 25 percent, without damaging diagnostic accuracy, which is pretty important.
The biggest obstacle slowing adoption is still the need for massive, varied, and carefully annotated training datasets that reflect all the clinical scenarios doctors run into. Building that kind of dataset requires tight cooperation across multiple medical centers, and it also means patient imaging information has to be shared under extremely strict confidentiality agreements, which can be slow and messy at times.
Key Market Trends
- Oncology imaging is set to contribute 54.8% of PET scanner revenue in 2025, at least thats the gist, powered by molecular tumor profiling mixed with immunotherapy monitoring protocols across US cancer centers.
- Cardiology PET use is really taking off, and it seems to be moving faster than the overall market. Roughly 5.2% compound annual growth rate, through 2033, mainly because there are more indications for assessing viable myocardium in heart failure populations.
- PET/CT systems pretty much hold the ground here, they account for 68% of product segment revenue since integrated dual modality imaging is basically the clinical norm for anatomical localisation and even more precise treatment planning.
- Meanwhile digital detector PET systems jumped about 12% year over year in 2024, signaling a shift from analog photomultiplier tubes toward silicon photomultipliers and solid state photodiodes in system design.
- Dedicated brain PET scanners are the fastest moving category, over 7% CAGR, driven by updated Alzheimer’s disease diagnostic protocols plus the initiation requirements that come with anti amyloid monoclonal antibody therapy.
- Mobile PET systems are also expanding, around 8.5% each year, as regional medical centres add imaging capability without needing to drop a lot of money on permanent capital infrastructure equipment purchases.
- AI enhanced reconstruction and interpretation tools really accelerated adoption, boosting installed base uptake by 42% in 2024, and now it feels like a standard vendor offering, not some extra premium option.
- Radiopharmaceutical variety is climbing too, with FDA approvals for tau imaging agents and PSMA targeted agents for prostate cancer, which opens up additional clinical use cases
- And on the payer side, reimbursement pressure on conventional PET/CT codes keeps building, because commercial payers are imposing prior authorisation on oncology and cardiology indications more often than before.
North America PET Scanners Market Segmentation
By Product Type
Full ring PET scanners, like really the core of very high volume oncology imaging, yet somehow they are only 8% of our total market revenue because they insist on rather particular technical requirements. Partial ring setups also once pretty much led the way in early PET adoption, but now they are mostly outmoded in practice. PET/CT systems sit at 68% of the revenue, mainly since they bring that integrated dual modality platform together in one place. PET/MRI units come in at under 4% of installations mostly due to technical intricacy and that extremely high cost too. Mobile scanners are increasing though, roughly 8. 5% each year, year after year. Dedicated brain systems account for 12% of revenue, and they’re also moving forward at a 7% compound annual growth rate , CAGR. Digital PET is really transitioning, from premium products to what is becoming standard equipment across most manufacturers.
By application
Oncology makes about 54.8% of the PET scanner revenue, kind of mostly from routine tumor staging and also from treatment response monitoring, plus spotting relapses via established protocols. Cardiology’s viability imaging brings in roughly 18% of revenue — and this part is expanding pretty fast. Neurology, especially for Alzheimer’s disease diagnosis, is around 16% and it keeps growing at over 5% CAGR. Infection imaging, including endocarditis along with osteomyelitis, sits near 6% of revenue. Drug development and other research uses contribute about 3%. Then there are precision medicine applications, which are starting to appear as their own category at under 2%, yet they’re climbing in double digit rates.
By detector type
Digital detectors are really expanding, i mean you can see the shift… they went from 12% market share in 2022 to about 28% by 2025, because manufacturers have been moving away from analog photomultiplier tube systems. On top of that, silicon photomultipliers make up roughly 35% of every new installation. Still, scintillation crystal detectors stay around 22% of all existing systems, even if the new sales are slowing down a bit.
Hybrid detectors that mix different technologies have grown from 3% up to 12% market share, and it feels like the premium differentiation thing is driving that too. Then there’s the high-sensitivity detector systems, the ones made specifically for low-dose pediatric use and neuroscience work, which is a pretty recent niche, not really mature yet.
And finally, AI-enhanced detector responses plus image optimization software are now bundled with each hardware purchase by every manufacturer, pretty much automatically.
By end user
Hospitals and super large cancer centers make up something like 61% of PET scanner installs , and they also end up producing around 68% of our total market revenue. Diagnostic imaging centers contribute roughly 18% of the revenue, but they’re pushing ahead way faster at a 5.8% CAGR because independent operators keep adding more PET capacity. Academic institutions account for about 12% of installed systems mostly for study, and “learning” related reasons, too. Specialized cancer centers tend to push the newer technologies , and they usually ask for very high end specifications. Government facilities, including VA medical centers, land at about 5% of the market. Research centers sit near 3% of revenue, with pretty exacting requirements for long term investigations and drug development trials.
By Portability
Fixed systems are still holding about 72% of the installed base, but honestly they’re sliding as a share of what gets bought new. Mobile systems only account for roughly 12% of recent installs, although that number keeps ticking up, around 8.5% every year. Compact systems that are built for outpatient clinics come in at 8% of the market and they keep growing, about 9.2% annually. Then there are hybrid platforms, they sort of blend fixed and mobile abilities, and they’re now showing up as an emerging slice at 4% of new sales. High-resolution integrated systems, aimed at narrower tasks for instance brain imaging, make up 3% of the market, but they’re expanding pretty quickly too. And multi-modality integrated platforms, the ones that combine PET with other imaging modalities, they’re doing better than standalone systems when it comes to growth rates.
What are the Key Use Cases Driving the North America PET Scanners Market?
Monitoring oncology treatment responses is kinda the main application, usually involving serial PET scans after 1-2 rounds of chemo. Those early scans help predict overall survival, and they also nudge therapy plan adjustments. For Non-small cell lung cancer, Hodgkin lymphoma, and metastatic breast cancer, clinicians use PET imaging during routine clinical procedures, so you end up with repeated imaging volumes regardless of patient demographics.
Diagnosing neurodegenerative diseases, and especially Alzheimer’s disease with amyloid and tau imaging, has become the fastest-growing application area for us. FDA clearance of anti-amyloid monoclonal antibodies really did introduce a stronger medical necessity, in the sense that amyloid PET verification happens before starting therapy, and the imaging needs track closely with medication usage itself.
Cardiology viability imaging in heart failure patients who are being evaluated for revascularization plans is another notable area, even if it stays relatively steady. Myocardial perfusion assessment with PET helps separate viable myocardium that can be revascularized from scarred tissue, and that distinction then influences surgical decisions, as well as patient outcomes itself.
|
Report Metrics |
Details |
|
Market size value in 2025 |
USD 402.6 Million |
|
Market size value in 2026 |
USD 415.9 Million |
|
Revenue forecast in 2033 |
USD 521.9 Million |
|
Growth rate |
CAGR of 3.30% from 2026 to 2033 |
|
Base year |
2025 |
|
Historical data |
2021 - 2024 |
|
Forecast period |
2026 - 2033 |
|
Report coverage |
Revenue forecast, competitive landscape, growth factors, and trends |
|
Regional scope |
United States, Canada |
|
Key companies profiled |
GE HealthCare, Siemens Healthineers, Philips, Canon Medical, United Imaging Healthcare, Shimadzu, Mediso, Bruker, Cubresa, Positron Corporation, Neusoft Medical Systems, MinFound Medical Systems, PerkinElmer, Fujifilm Healthcare, Hitachi Healthcare. |
|
Customization scope |
Free report customization (country, regional & segment scope). Avail customized purchase options to meet your exact research needs. |
|
Report Segmentation |
By Product Type (Full-Ring, Partial-Ring, Digital, PET/CT, PET/MRI, Mobile, Dedicated Brain), By Application (Oncology, Cardiology, Neurology, Drug Development, Infection, Research, Precision Medicine), By Detector Type (Digital, Analog, Silicon Photomultipliers, Scintillation, Hybrid, High-Sensitivity, AI-Enhanced), By End User (Hospitals, Diagnostic Centers, Academic Institutes, Research Centers, Cancer Centers, Specialty Clinics, Government, Others), By Portability (Fixed, Mobile, Compact, Hybrid, High-Resolution, Integrated, Multi-Modality). |
Which Regions are Driving the North America PET Scanners Market Growth?
In North America, the US basically accounts for ~88 per cent of PET scanner revenue — and it’s largely because healthcare expenditure is really high, cancer incidence is quite high too, and reimbursement rates are relatively solid for imaging procedures that are already well established. There’s also quite a bit of attention on a bunch of National Cancer Institute–designated cancer centres sitting in the Northeast plus California, which ends up making a few localised demand pockets where PET/CT and those “special brain PET” systems feel like routine clinical practice. Medicare coverage rules, in a way, actually end up steering how much imaging gets done across US hospitals so any federal reimbursement decision becomes the decisive demand lever inside each institution.
Canada is roughly 12 per cent of North America’s market revenue, but growth is slower, mainly because government healthcare budgets are tightly constrained, and procurement is more centralised. Big hospital groups in places like Toronto, Vancouver, and Montreal have bought PET/CT systems over the past decade, and the ongoing replacement cadence should keep growth fairly modest through to 2033. The provincial systems tend to prefer more standard PET/CT setups, rather than the very top digital detector models, largely due to spending limits.
Who are the Key Players in the North America PET Scanners Market and How Do They Compete?
GE HealthCare and Siemens Healthineers together take in something like 55% of North America market revenue, mostly because of long standing ties with big hospital networks and those more integrated health care systems. GE kind of runs laps here with production scale plus a service setup that’s hard to match, while Siemens leans into better software integration, connecting its tools with hospital data systems—and then adds pretty advanced image processing techniques. Philips sits around 18% market share on its own, and a lot of that feels tied to solid state detector tech, plus how smoothly it blends with other imaging methods.
United Imaging Healthcare and Canon Medical are moving up fast in mobile PET, they do it with cost efficient designs and deployment plans that are almost annoyingly flexible. Mediso and Bruker seem to aim more at research and specialty use cases, with very sensitive systems that can do the finer stuff. Smaller players like Cubresa, Positron Corporation, and MinFound tend to stay in tighter niches—either by going direct, or through local distribution partners where it matters.
Lately, competition has drifted away from “just” hardware prowess and more toward software differences and the total cost of ownership picture overall. Firms that bundle AI enhanced reconstruction, smoother workflow integration, and full service contracts are pulling market share from others that focus mostly on hardware specs only. And yeah, having a dependable regional service footprint still matters a lot, especially for rural areas and smaller hospital networks where help right away can decide whether the equipment gets used frequently or not.
North America PET Scanners Market Companies
- GE HealthCare
- Siemens Healthineers
- Philips
- Canon Medical
- United Imaging Healthcare
- Shimadzu
- Mediso
- Bruker
- Cubresa
- Positron Corporation
- Neusoft Medical Systems
- MinFound Medical Systems
- PerkinElmer
- Fujifilm Healthcare
- Hitachi Healthcare
Recent Developments
In March 2026, GE HealthCare launched a new AI-powered PET/CT reconstruction platform that reduces radiation dose by 40% while maintaining diagnostic image quality. The system uses deep learning trained on over 500,000 clinical PET datasets to optimize image reconstruction parameters in real time.
Source: https://www.gehealthcare.com
In February 2026, Siemens Healthineers completed the acquisition of a software company specializing in PET image interpretation algorithms, expanding AI diagnostic support capabilities across its PET/CT and PET/MRI product lines.
Source: https://www.siemens-healthineers.com
In January 2026, United Imaging Healthcare announced FDA clearance for its new mobile PET system designed for regional medical centers and specialty oncology clinics. The system offers 40% weight reduction compared to previous generation designs, enabling deployment in non-hospital settings.
Source: https://us.united-imaging.com
What Strategic Insights Define the Future of the North America PET Scanners Market?
North America’s PET scanner market size over the next five to seven years is really going to be pulled along by adjustments in reimbursement policies , plus the way new radiopharmaceuticals are rolled into everyday clinical pathways. At the heart of it there’s this structural push people call precision medicine , and since genomic and molecular profiling is getting more normal in oncology and neurology , PET imaging is sliding from “nice to have” to something closer to required for crafting treatment plans. That basically builds a stable base demand , which helps shield existing scanners from an economic slow patch , even if it doesn’t spark super fast capacity jumps.
The part that is harder to forecast is the possibility of blood based biomarkers showing up in neurodegenerative diseases. If serum phosphorylated tau and amyloid beta testing turns out to be sensitive enough to stand in for PET imaging when screening for Alzheimer’s disease, we could end up seeing something like a 15-25% dip in demand for dedicated brain PET systems by 2030. Companies that are heavily positioned in dedicated brain systems , might find their core offering quietly replaced by alternatives.
Where the upside looks most tangible is expanding imaging capacity across regions using small, more portable PET systems. Regional cancer centers and niche oncology clinics look like a mostly under served space , since big PET/CT platforms are still too pricey for many settings . If you can bring smaller options into the same clinical routines , then adoption becomes more realistic. Early arriving vendors in that corner will likely lock in relationships with distributors , and write clinical protocols that others may have a hard time matching. So the strategic suggestion here is to diversify your product line , and lean harder toward modular , easy to deploy systems instead of putting most of your effort into large, fixed site installations.
North America PET Scanners Market Report Segmentation
By Product Type
- Full-Ring
- Partial-Ring
- Digital
- PET/CT
- PET/MRI
- Mobile
- Dedicated Brain
By Application
- Oncology
- Cardiology
- Neurology
- Drug Development
- Infection
- Research
- Precision Medicine
By Detector Type
- Digital
- Analog
- Silicon Photomultipliers
- Scintillation
- Hybrid
- High-Sensitivity
- AI-Enhanced
By End User
- Hospitals
- Diagnostic Centers
- Academic Institutes
- Research Centers
- Cancer Centers
- Specialty Clinics
- Government
- Others
By Portability
- Fixed
- Mobile
- Compact
- Hybrid
- High-Resolution
- Integrated
- Multi-Modality
Frequently Asked Questions
Find quick answers to common questions.
The North America PET Scanners Market size is expected to reach USD 521.9 Million by 2033.
The key segments are By Product Type (Full-Ring, Partial-Ring, Digital, PET/CT, PET/MRI, Mobile, Dedicated Brain), By Application (Oncology, Cardiology, Neurology, Drug Development, Infection Imaging, Research, Precision Medicine), By Detector Type (Digital, Analog, Silicon Photomultipliers, Scintillation, Hybrid, High-Sensitivity, AI-Enhanced), By End User (Hospitals, Diagnostic Imaging Centers, Academic Institutes, Research Centers, Cancer Centers, Specialty Clinics, Government Facilities), and By Portability (Fixed, Mobile, Compact, Hybrid, High-Resolution, Integrated, Multi-Modality).
Major players include GE HealthCare, Siemens Healthineers, Philips, Canon Medical, United Imaging Healthcare, Shimadzu, Mediso, Bruker, Cubresa, Positron Corporation, Neusoft Medical Systems, MinFound Medical Systems, PerkinElmer, Fujifilm Healthcare, and Hitachi Healthcare.
The North America PET Scanners Market size is USD 402.6 Million in 2025.
The North America PET Scanners Market CAGR is 3.30% from 2026 to 2033.
- GE HealthCare
- Siemens Healthineers
- Philips
- Canon Medical
- United Imaging Healthcare
- Shimadzu
- Mediso
- Bruker
- Cubresa
- Positron Corporation
- Neusoft Medical Systems
- MinFound Medical Systems
- PerkinElmer
- Fujifilm Healthcare
- Hitachi Healthcare
About the Authors

Pankaj Ghogare Patil
I am Pankaj Ghogare Patil, a Senior Research Analyst at Transpire Insight, specializing in the Pharmaceutical, Chemicals & Materials, Healthcare IT, and Biotechnology industry. My expertise lies in conducting comprehensive market research, analyzing industry trends, evaluating competitive landscapes, and translating complex data into actionable insights. At Transpire Insight, I closely follow emerging technologies, regulatory developments, and market innovations to create accurate, well-researched, and informative content that helps businesses and professionals make informed decisions. I am committed to producing credible, evidence-based articles that reflect industry best practices while making technical topics accessible and valuable for a broad audience.

Chakradhar Khansole
Chakradhar serves as the Research Director at Transpire Insight, bringing over 8 years of experience in technology, innovation, and strategic market intelligence. He specializes in transforming complex market data into actionable business insights that enable organizations to make informed, growth-oriented decisions. Recognized for his strategic vision and analytical expertise, Chakradhar leads high-impact research initiatives, delivering comprehensive market assessments, competitive intelligence, and forward-looking industry analysis.
Recently Published Reports
-
Apr 2026
AI in Diabetic Retinopathy Market
AI in Diabetic Retinopathy Market Size, Share & Analysis Report By Type (Screening AI Systems, Diagnostic AI Systems, and Predictive AI Models), By Application Segment (Hospitals, Ophthalmology Clinics, Diagnostic Centers, and Research and Development), and Geography (North America, Europe, Asia-Pacific, Middle East and Africa, South and Central America), 2021 - 2031
-
Apr 2026
Psychometric Tests Market
Psychometric Tests Market Size, Share & Analysis Report By Type (Personality Tests, Ability/Aptitude Tests, Skill/Knowledge Tests, and Others), By Application (Talent Acquisition and Talent Management), and Geography (North America, Europe, Asia-Pacific, Middle East and Africa, South and Central America), 2021 – 2031
-
Apr 2026
Rare Biological Sample Collection Market
Rare Biological Sample Collection Market Size, Share & Analysis Report By Type (Isolation Kits & Reagent, Blood Collection Tubes, and Others), By Application (Oncology, Transcriptomics, Pharmacogenomics, and Others), and Geography (North America, Europe, Asia-Pacific, Middle East and Africa, South and Central America), 2021 – 2031
-
Jul 2026
Diabetic Retinopathy Market
Diabetic Retinopathy Market Size, Share & Analysis Report By Type (Proliferative Diabetic Retinopathy, and Diabetic Macular Edema (DME)), By Treatment Type (Anti VEGF Drug, Steroid Implants, Laser Surgeries, and Vitrectomy), and Geography (North America, Europe, Asia-Pacific, Middle East and Africa, South and Central America), 2021 – 2031
Our Clients