
United States Virtual Reality Market Summary
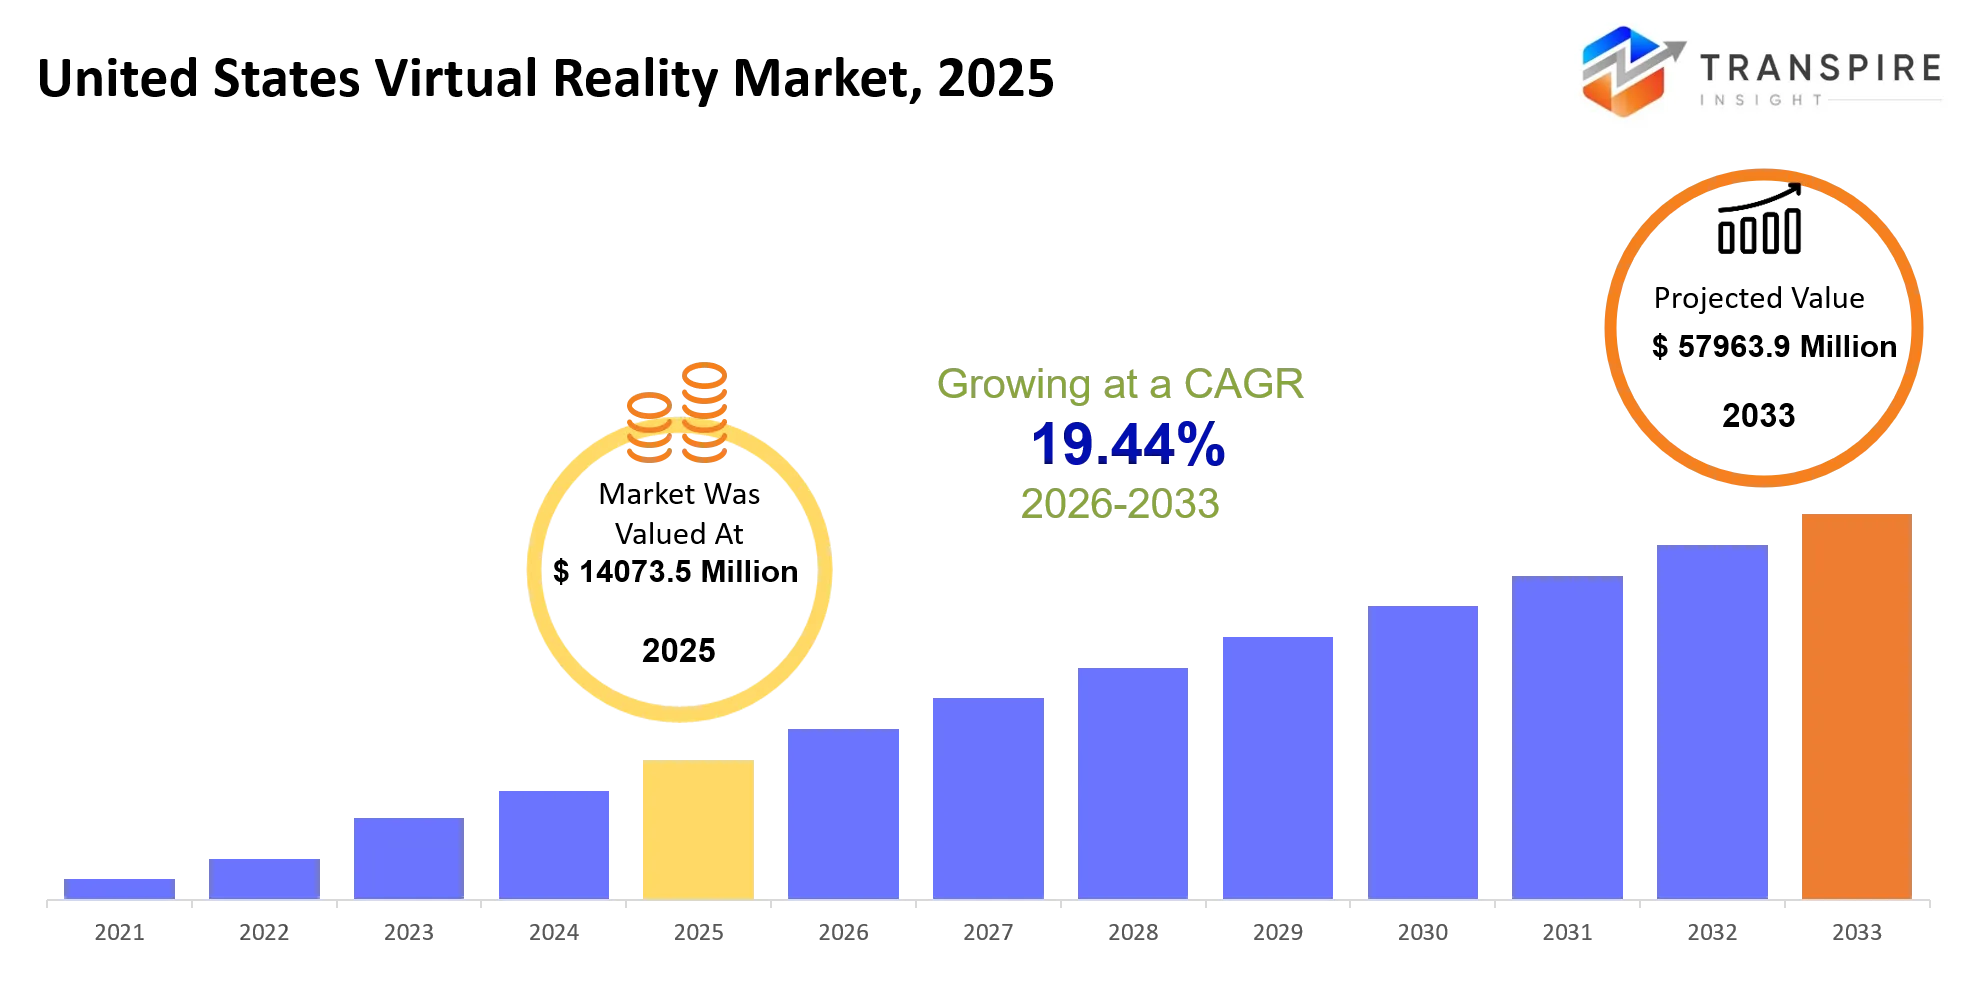
As per Transpire Insight Analysis the United States Virtual Reality Market size is estimated at USD 14073.5 Million in 2025 and is anticipated to reach USD 57963.9 Million by 2033, growing at a CAGR of 19.44% from 2026 to 2033.
The United States Virtual Reality Market basically holds up, servers storage, networking, security, and connectivity that keep websites, business apps, cloud workloads, and digital platforms on 24/7. In the past three to five years, things sort of moved away from conventional hosting and leaned more toward hybrid cloud, hyperscale infrastructure , edge computing, and more AI-ready environments, since enterprises kept pushing extra workloads into scalable frameworks. Then generative AI sped things up in a very practical way, so providers started to create higher-density computing spaces, upgrade cooling systems , and add extra secure power capacity. The International Energy Agency also says U.S. data-center electricity use could climb by roughly 240 TWh by 2030, compared with 2024, so you can see how big the infrastructure buildout really has to be. On top of that, grid constraints , slower interconnection timelines, and rising compute intensity are reshaping where sites get picked and where infrastructure gets invested.
United States Virtual Reality Market Size & Forecast:
- United States Virtual Reality Market Size 2025: USD 14073.5 Million
- Expected Market Value 2033: USD 57963.9 Million
- Forecast CAGR:19.44%
- Key Profile: Meta Platforms, Apple Inc., Sony Group, HTC Corporation, Valve Corporation, Microsoft Corporation, NVIDIA Corporation, Qualcomm Technologies, Unity Technologies, Epic Games, Varjo Technologies, PICO Interactive, Lenovo Group, HP Inc., DPVR
Key Market Insights
- The United States Virtual Reality Market seems to be moving toward AI-ready, hyperscale, hybrid cloud, and edge setups, kind of backed by ongoing enterprise digitalization that just keeps growing.
- Market value is expected to rise, from USD 14.07 billion in 2025 to something like USD 57.96 billion by 2033, so overall it looks like there will be serious, steady investment in long-term infrastructure.
- In terms of regions, Northern Virginia still leads pretty clearly. It’s projected to hit around 4,039.6 MW of data-center inventory in 2025, and that’s largely tied to dense fiber connectivity and lots of hyperscale deployments nearby.
- If we look for the quickest expansion, Texas plus other Southern markets are picking up speed. The reasons are usually the big land parcels, power availability, and that ongoing hyperscale campus build-out, which basically makes it easier to scale faster.
- The service mix is also shifting. Cloud hosting and dedicated infrastructure still keep a strong position, but hybrid environments are expanding too, especially as enterprises link private systems with public cloud platforms, in a more “in-between” manner.
- On the AI infrastructure side, GPU-based hosting is becoming the fastest moving service category. Providers keep adding high-density computing, better cooling approaches, and high-speed networking so they can handle heavy workloads without too much slowdown.
- Power demand is getting more attention. U.S. data-center electricity consumption might increase by roughly 240 TWh between 2024 and 2030 , and that alone is reinforcing plans for new hosting capacity and all the related build activities.
- As for application trends, enterprise cloud workloads remain the dominant base, but generative AI, machine learning, analytics ,and high performance computing are driving new infrastructure needs that weren’t as urgent before.
- End users are changing in a similar way: hyperscalers and major technology companies control a large amount of capacity , while SMEs are increasingly choosing managed hosting as a way to lower capital expenditure and avoid the whole infrastructure maintenance burden.
- Finally, technology advancement is becoming a competitive edge. Liquid cooling, AI workload orchestration, GPU acceleration, and high-speed optical networking are turning into differentiators that infrastructure providers are using to stand out.
What are the Key Drivers, Restraints, and Opportunities in the United States Virtual Reality Market?
Driver: AI adoption has become this kinda major infrastructure catalyst, you know. The AI training and inference workloads need a lot more computing density than typical enterprise apps, which pushes cloud providers and hosting operators to beef up GPU capacity, high-speed networking, storage, and even advanced cooling setups. Under the newest DOE-linked estimates, U.S. data centers might land around 11.8% of national electricity use by 2030 , so infrastructure investment is basically a core condition for continued digital growth.
Restraint: Still, power availability and grid interconnection stay as structural limits. You can’t just scale new hosting facilities by stacking more servers, because substations, transmission bandwidth, transformers, permitting, and local utility support have long planning timelines. Deloitte flags grid stress as a leading infrastructure complication, and some connection requests can be stuck waiting as much as seven years.
Opportunity: There’s an opening though, with edge infrastructure and power flexible AI data centers giving a fresh expansion route. Distributed facilities can put compute nearer to end users, which helps reduce latency, and workload scheduling can also steer more adaptable AI workloads to places where electricity capacity is sitting open. A few emerging U.S. builds that pair data centers with batteries, on site generation, and renewable resources could speed up deployment, especially where conventional grid hookups are still constrained.
What Has the Impact of Artificial Intelligence Been on the United States Virtual Reality Market?
Artificial intelligence has sort of reshaped hosting infrastructure from what used to be a fairly standardized computing environment into this high-density infrastructure business, where you need specialized processors, networking, cooling, storage, and power management, all at once.Gaming training and inference workloads are moving more and more toward GPU clusters, and the machine learning systems now also help with capacity forecasting, workload scheduling, predictive maintenance, and automated infrastructure monitoring. On top of that, AI workload orchestration can shift more flexible computing tasks between facilities, depending on electricity availability, grid conditions, and the operating requirements. Research on power-flexible AI data centers suggests that workload scheduling can deliver quick load reduction and long-running curtailment, while still keeping service levels intact for priority jobs.
The day to day operational impact goes beyond “just” compute capacity, too. Higher density racks are pushing liquid cooling, along with thermal management upgrades, battery storage, and on-site generation. At the same time , data center operators are more and more tuning their power usage along with raw computing performance. The IEA expects U.S. data center electricity consumption to rise by about 240 TWh between 2024 and 2030 , which basically points to the massive infrastructure scale that comes with AI deployment. Even so , AI adoption has a fairly solid snare: power availability, as well as grid interconnection. That can pace things down a lot, and certain U.S. projects are even sharing connection queues that drag on for several years.
Key Market Trends
- Since 2020, U.S. electricity demand has picked up , pretty noticeably, and data centers are now a big part of that national load increase.
- Generative AI has basically nudged data center design toward GPU heavy spaces , so it comes with extra needs like more intense cooling, faster networking, and a lot more power on tap.
- In fact U.S. data center electricity use is expected to jump by roughly 240 TWh by 2030, which will just make infrastructure investment feel even more urgent.
- Cloud buyers too, are leaning into a mix of public cloud plus private infrastructure, so the appetite grows for hybrid hosting , orchestration, back up options, and smoother workload portability. Also edge computing, has moved beyond a purely centralized setup, because AI apps want lower delay, and they benefit from compute closer to real users.
- And power limits are starting to steer where sites get built, pushing operators to weigh on site generation, batteries, renewable resources, and even alternate regions.
- Liquid cooling meanwhile is getting more attention, since AI racks tend to run hotter than standard office style computing. Hosting providers are also competing on a wider set of factors, not just “availability” but deployment speed, cybersecurity strength, energy efficiency, GPU supply, and network performance.
- Meanwhile, data center development is spreading across more U.S. states, as companies look for land options, higher power capacity, friendlier permitting, and a bit of geographic diversification.
- All of this AI infrastructure spending is also driving new ways to operate, with systems that coordinate computing work against electricity pricing, grid situations, and whatever generation is actually available.
United States Virtual Reality Market Segmentation
By Product Type
Mulch Films kind of back up soil protection, help with moisture control too, manage temperature in a steadier way, and also bring down weed growth across most agricultural fields. Greenhouse Films work to make more protected growing conditions, sort of through light management and heat control, keeping humidity in check and reducing outside exposure that would otherwise mess things up. Silage Films and Bale Wrap Films assist forage preservation by limiting oxygen movement and moisture during storage periods. Stretch Films offer flexible coverage for wrapped agricultural products, while Tunnel Films support protected cultivation on vegetable farms as well as specialty crop operations, depending on how they plan it.
Fumigation Films help keep treatment gases inside covered soil zones during pest and disease control. Pond Liners reduce water seepage and help with water storage for irrigation and other agricultural activities. Crop Covers shield plants from chosen weather patterns, certain insects, and sudden temperature shifts. Other options include specialized films for nursery production, specialty crops, experimental cultivation, and a range of additional agricultural needs.
By Material
LDPE kinda gives flexibility, some good moisture resistance, and it’s also straightforward to process , for a few types of agricultural film uses. LLDPE tends to bring better tensile strength along with higher puncture resistance, which makes LLDPE handy for stretch wraps and silage products. HDPE shows up with more stiffness and long lasting durability, especially when a stronger barrier is needed . EVA adds flexibility along with clarity and adhesion too, and PVC can support certain greenhouse or protective covering scenarios .
Biodegradable Films act like an alternative option for farms that want materials with less hassle after use and fewer disposal burdens. Polypropylene brings strength plus chemical resistance for certain agricultural purposes, while Ethylene Copolymers can back specialized performance goals. Recycled Plastics help cut back on reliance on virgin polymer sources , and Others include tailored formulations meant for specific farm conditions, plus the film performance requirements.
By Application
Crop Protection uses films to dial down exposure to iffy weather, insect activity, temperature swings, and other rough field situations. Soil Moisture Retention work basically helps curb evaporation while also backing up efficient irrigation. In Greenhouse Farming, protective films come in handy for sorting out light, temperature, humidity, and how much the crop gets exposed in general. Silage Preservation really leans on dependable barriers, because they limit oxygen and moisture contact during forage storage, so things stay stable
Weed Control films work by cutting down the sunlight that reaches soil surfaces, and that in turn slows weed growth near cultivated plants. Water Conservation applications aim for lower evaporation rates, plus better use of irrigation resources, overall. Fruit Cultivation and Vegetable Cultivation both rely on films for moisture management, weed reduction, temperature control, and crop protection. Floriculture uses more specialized coverings for controlled flower production, while Others covers nursery production too, and various specialty agricultural applications
By End User
Commercial Farms usually buy agricultural films for crop protection, soil handling, greenhouse growing, and water conservation, kinda for keeping everything steady. Greenhouses need films that help maintain stable growing conditions , manage light, control temperature, and still give crop protection. Horticulture Farms put these films to work across fruit and vegetable lots, nursery setups, and specialty crop production. Dairy Farms mostly rely on Silage Films and Bale Wrap Films, so the stored forage stays protected and the feed quality is kept nice.
Agricultural Cooperatives help with group purchasing and make it easier to access agricultural film products throughout farming communities. Government Farms use films for production programs, demonstration projects , and institutional cultivation. Research Institutes need more specialized materials for crop trials, greenhouse studies, and controlled experiments. Organic Farms look closely at material composition and disposal requirements, while Others cover nurseries, specialty growers, and agricultural service providers.
By Distribution Channel
Direct Sales kind of bridge manufacturers with commercial farms, greenhouse operators cooperatives, and institutional buyers that need larger volumes or custom specs. Agricultural Dealers give more regional access to films and basic ag supplies , plus they help with picking the right product. Online Retail makes it easier to purchase for smaller farms, and specialty growers who want a bit more targeted stuff. Cooperatives back group procurement and in practice, they can unlock volume benefits too .
Distributors move products across broader geographic areas and keep inventory on hand for agricultural dealers and farming customers. Wholesalers do the big buy then they push it to downstream businesses, usually during those seasonal demand spikes. Retail Stores give a straightforward way to get standard agricultural film products when time matters. OEM Supply handles customized film needs for agricultural equipment and built in systems, while Others covers specialized marketplaces and those institutional procurement routes.
What are the Key Use Cases Driving the United States Virtual Reality Market?
Cloud application hosting is still, like mostly, the big thing everyone goes for, because enterprises want scalable compute , storage, backup, cybersecurity , and reliable network access without having to keep every physical piece of infrastructure inside their own walls. And yeah, firms across financial services, healthcare, retail, manufacturing, and software are moving more and more toward managed or hybrid setups to keep business apps and digital services running.
At the same time AI workloads and high-performance computing are growing fast, especially for technology companies, research groups, and the larger enterprises. GPU-heavy applications really do need purpose-built hosting infrastructure, with more power density, more advanced cooling, fast networking, and extra storage room. Also U.S. data-center electricity use is projected to climb by roughly 240 TWh by 2030, which basically shows the real-world footprint of these workloads on the electrical side.
Newer patterns are popping up too, things like edge AI, distributed computing, and grid-responsive infrastructure. Edge facilities can put inference closer to users for lower latency , while smart, flexible workload scheduling can move certain AI tasks to spots where power is available and grid pressure is comparatively lower.
|
Report Metrics |
Details |
|
Market size value in 2025 |
USD 14073.5 Million |
|
Market size value in 2026 |
USD 16676.6 Million |
|
Revenue forecast in 2033 |
USD 57963.9 Million |
|
Growth rate |
CAGR of 19.44% from 2026 to 2033 |
|
Base year |
2025 |
|
Historical data |
2021 - 2024 |
|
Forecast period |
2026 - 2033 |
|
Report coverage |
Revenue forecast, competitive landscape, growth factors, and trends |
|
Regional scope |
United States |
|
Key company profiled |
Meta Platforms, Apple Inc., Sony Group, HTC Corporation, Valve Corporation, Microsoft Corporation, NVIDIA Corporation, Qualcomm Technologies, Unity Technologies, Epic Games, Varjo Technologies, PICO Interactive, Lenovo Group, HP Inc., DPVR |
|
Customization scope |
Free report customization (country, regional & segment scope). Avail customized purchase options to meet your exact research needs. |
|
Report Segmentation |
By Component (Hardware, Software, VR Content, Services, Head-Mounted Displays, Controllers, Sensors, VR Cameras, Accessories, Others); By Device Type (Standalone VR Headsets, PC-Based VR Headsets, Smartphone VR Headsets, Console VR Headsets, Enterprise VR Systems, Mixed Reality Headsets, Wearable VR Devices, Others); By Application (Gaming, Healthcare, Education, Retail, Manufacturing, Real Estate, Defense, Media & Entertainment, Tourism, Others); By End User (Consumers, Enterprises, Healthcare Providers, Educational Institutions, Government, Military, Retailers, Industrial Companies, Others); By Technology (Immersive VR, Semi-Immersive VR, Non-Immersive VR, Cloud VR, AI-Integrated VR, Wireless VR, Tethered VR, Metaverse Platforms, Others) |
Which Regions are Driving the United States Virtual Reality Market Growth?
Northern Virginia still comes out as the leading U.S. hosting infrastructure region because it has this unmatched clumping of hyperscale cloud capacity , plus network connectivity, and honestly, a solid enterprise backbone that is already there. In 2025 it logged 1,102 MW of net absorption , while total inventory hit 4,039.6 MW, which is about 37% year-over-year growth. There’s also a mature fiber ecosystem, major cloud-provider presence, and longtime connectivity strengths that keep pulling in high-value deployments, even if the amount of powered land is getting tighter, so supply is slowly getting squeezed.
Then you’ve got the South , and especially Texas and Atlanta, where the growth story feels a lot more tied to land that’s actually available, the power situation, and this campus-style, large-scale development rhythm. Dallas-Fort Worth pulled in 470.8 MW in 2025, which is a pretty sharp jump versus the prior year. Atlanta meanwhile keeps landing hyperscale and AI initiatives, mostly because big sites can more easily handle campus-scale expansion. Put together, the mix of development land, power infrastructure that keeps expanding, and investment conditions that tend to be business-friendly gives those southern markets a wider runway for growth than Northern Virginia.
The Midwest looks like the next, more credible emerging growth track too ,Accessoriesas developers try to diversify away from the very constrained coastal hubs. Chicago is still a big, well-established market, while places like Michigan and Ohio are drawing projects by leaning on available land, comparatively more flexible permitting, and the prospect of better power access. Even Microsoft’s development activity in Wisconsin signals how large technology companies are pushing advanced computing capacity into newer locations, and that creates practical openings for infrastructure developers, power suppliers, and hosting specialists stretching through 2033.
Who are the Key Players in the United States Virtual Reality Market and How Do They Compete?
Competition in U.S. hosting infrastructure is pretty darn concentrated around firms that basically steer the whole show, like they control computing platforms, cloud ecosystems, processors, networking technology or big digital workloads. The main competitive forces have slid away from just raw server capacity , and moved toward AI computing density, power availability, network performance, security, cooling efficiency , plus how fast you can actually deploy. Hyperscale operators now tend to compete with vertically integrated infrastructure, while semiconductor and platform companies sort of steer the hosting economics using specialized hardware and software, sometimes quietly but still very effectively.
Microsoft in particular differentiates Azure using proprietary infrastructure , like Cobalt CPUs and Maia AI accelerators, plus it already has a huge geographic data-center footprint. Microsoft said it wants to grow AI capacity by more than 80% in fiscal 2026, and its Wisconsin and Texas projects show that expansion is still happening, not just in theory. Meta Platforms is going for an AI-optimized approach too, with lots of NVIDIA GPUs, and by developing custom data-center CPUs using Arm, so it can keep more leverage over performance and overall infrastructure efficiency.
NVIDIA competes in a different way, it supplies the computing architecture that hosting providers and hyperscalers use to build AI factories. Its 2026 partnerships with Lumentum, Marvell, and IREN push its reach into optical networking, custom infrastructure, power availability, and multi-gigawatt data-center deployment. Apple and Sony, meanwhile, depend more on vertically managed digital ecosystems and high-performance consumer platforms. Lenovo and HP compete through enterprise hardware, workstation, and infrastructure portfolios that connect on-premises setups with cloud services, kind of bridging both worlds.
Company List
- Meta Platforms
- Apple Inc.
- Sony Group
- HTC Corporation
- Valve Corporation
- Microsoft Corporation
- NVIDIA Corporation
- Qualcomm Technologies
- Unity Technologies
- Epic Games
- Varjo Technologies
- PICO Interactive
- Lenovo Group
- HP Inc.
- DPVR
Recent Development News
"In February 2026, NVIDIA and Meta Platforms announced a multiyear strategic partnership. The agreement supports hyperscale AI data centers through large-scale deployment of NVIDIA CPUs, networking technologies, and millions of Blackwell and Rubin GPUs, strengthening demand for high-density U.S. hosting infrastructure.https://investor.nvidia.com/news/press-release-details/2026/Meta-Builds-AI-Infrastructure-With-NVIDIA/default.aspx (NVIDIA)."
"In March 2026, NVIDIA invested $2 billion in Lumentum and entered multiyear strategic agreements to expand advanced optical technology and U.S.-based manufacturing capacity. The commitment strengthens the optical connectivity supply chain required to scale next-generation AI data centers.https://nvidianews.nvidia.com/news/nvidia-announces-strategic-partnership-with-lumentum-to-develop-state-of-the-art-optics-technology (NVIDIA Newsroom)."
"In April 2026, Microsoft announced its intent to purchase approximately 3,200 acres in Cheyenne, Wyoming, for a new data center. The expansion strengthens Wyoming as an emerging hosting location and adds capacity to Microsoft's growing U.S. infrastructure footprint.https://news.microsoft.com/source/2026/04/14/microsoft-announces-intent-to-expand-datacenter-operations-in-cheyenne-accelerating-innovation-and-economic-growth/ (Microsoft)."
What Strategic Insights Define the Future of the United States Virtual Reality Market?
The U.S. hosting infrastructure market is basically heading toward AI-dense, power aware , and geographically scattered computing, not just stacking more normal server capacity. The key reason is the fast move away from generic cloud jobs toward GPU heavy training, inference, and agentic AI, and that flips what people actually need for electricity, heat control, high speed networking ,and even how the facility gets designed. There’s also a more low profile risk, like market concentration in places that are already power limited. If grid hookups stall, then big chunks of planned capacity can end up commercially unusable even when customer demand stays strong.
The newer chance is grid interactive AI data centers that can nimbly tune workloads based on electricity conditions, so operators can lock in usable capacity where conventional grid expansion is slow or complicated. In 2025, there was a Phoenix demonstration where a 256 GPU cluster cut its power draw by 25% for three hours during peak moments, yet kept the AI service quality guarantees intact. So market players should sort of focus on sites with secured power, flexible load handling, better cooling systems, and multi year utility agreements ,instead of chasing land availability only.
United States Virtual Reality Market Report Segmentation
By Product Type
• Mulch Films
• Greenhouse Films
• Silage Films
• Stretch Films
• Tunnel Films
• Bale Wrap Films
• Fumigation Films
• Pond Liners
• Crop Covers
• Others
By Material
• LDPE
• LLDPE
• HDPE
• EVA
• PVC
• Biodegradable Films
• Polypropylene
• Ethylene Copolymers
• Recycled Plastics
• Others
By Application
• Crop Protection
• Soil Moisture Retention
• Greenhouse Farming
• Silage Preservation
• Weed Control
• Water Conservation
• Fruit Cultivation
• Vegetable Cultivation
• Floriculture
• Others
By End User
• Commercial Farms
• Greenhouses
• Horticulture Farms
• Dairy Farms
• Agricultural Cooperatives
• Government Farms
• Research Institutes
• Organic Farms
• Others
By Distribution Channel
• Direct Sales
• Agricultural Dealers
• Online Retail
• Cooperatives
• Distributors
• Wholesalers
• Retail Stores
• OEM Supply
• Others
Frequently Asked Questions
Find quick answers to common questions.
The expected United States Virtual Reality Market size for the market will be USD 57963.9 Million in 2033.
Key segments for the United States Virtual Reality Market are By Component (Hardware, Software, VR Content, Services, Head-Mounted Displays, Controllers, Sensors, VR Cameras, Accessories, Others); By Device Type (Standalone VR Headsets, PC-Based VR Headsets, Smartphone VR Headsets, Console VR Headsets, Enterprise VR Systems, Mixed Reality Headsets, Wearable VR Devices, Others); By Application (Gaming, Healthcare, Education, Retail, Manufacturing, Real Estate, Defense, Media & Entertainment, Tourism, Others); By End User (Consumers, Enterprises, Healthcare Providers, Educational Institutions, Government, Military, Retailers, Industrial Companies, Others); By Technology (Immersive VR, Semi-Immersive VR, Non-Immersive VR, Cloud VR, AI-Integrated VR, Wireless VR, Tethered VR, Metaverse Platforms, Others)
Major United States Virtual Reality Market players are Meta Platforms, Apple Inc., Sony Group, HTC Corporation, Valve Corporation, Microsoft Corporation, NVIDIA Corporation, Qualcomm Technologies, Unity Technologies, Epic Games, Varjo Technologies, PICO Interactive, Lenovo Group, HP Inc., DPVR
The United States Virtual Reality Market size is USD 14073.5 Million in 2025.
The United States Virtual Reality Market CAGR is 19.44%from 2026 to 2033.
- Meta Platforms
- Apple Inc.
- Sony Group
- HTC Corporation
- Valve Corporation
- Microsoft Corporation
- NVIDIA Corporation
- Qualcomm Technologies
- Unity Technologies
- Epic Games
- Varjo Technologies
- PICO Interactive
- Lenovo Group
- HP Inc.
- DPVR
About the Authors

Mayur Shinde
I am Mayur Shinde, a Senior Research Analyst at Transpire Insight, specializing in the Automotive & Transportation and Information & Communication Technology (ICT) Industry. My work focuses on analyzing emerging market trends, technological advancements, competitive landscapes, and industry developments to deliver accurate, data-driven insights. I am passionate about transforming complex market information into clear, actionable content that helps businesses, professionals, and decision-makers stay informed and make confident strategic decisions.

Chakradhar Khansole
Chakradhar serves as the Research Director at Transpire Insight, bringing over 8 years of experience in technology, innovation, and strategic market intelligence. He specializes in transforming complex market data into actionable business insights that enable organizations to make informed, growth-oriented decisions. Recognized for his strategic vision and analytical expertise, Chakradhar leads high-impact research initiatives, delivering comprehensive market assessments, competitive intelligence, and forward-looking industry analysis.
Recently Published Reports
-
Apr 2026
3D Optical Profiler Market
3D Optical Profiler Market Size, Share & Analysis Report By Type (Desktop 3D Optical Profiler, and Portable 3D Optical Profiler), By Technology (Confocal Technology, and White Light Interference), By End-Use Industry (Manufacturing, Research Institutions, Automotive, Aerospace and Defense, Medical Devices, and Other), and Geography (North America, Europe, Asia-Pacific, Middle East and Africa, South and Central America), 2021 - 2031
-
Apr 2026
Depth Sensor Market
Depth Sensor Market Size, Share & Analysis Report By Type (Infrared Depth Sensors, Time-of-Flight (ToF) Sensors, Stereo Vision Sensors, Structured Light Sensors, Ultrasonic Depth Sensors), By Application (Automotive, Robotics, Gaming, Consumer Electronics, Industrial Automation, Healthcare, Security & Surveillance, Others), By End Users (Automotive Manufacturers, Consumer Electronics Companies, Healthcare Providers, Industrial Companies, Security Agencies, Gaming Companies, Robotics Companies, Others), and Geography (North America, Europe, Asia-Pacific, Middle East and Africa, South and Central America), 2021 – 2031
-
Apr 2026
Digital Manufacturing Market
Digital Manufacturing Market Size, Share & Analysis Report By Component (Hardware, Software, and Services), By Technology (Robotics, 3D Printing, Internet of Things (IoT), and Others), By Application (Automotive and Transportation, Aerospace and Defense, Consumer Electronics, Industrial Machinery, and Others), By Process Type (Computer-Based Designing, Computer-Based Simulation, Computer 3D Visualization, Analytics, and Others), and Geography (North America, Europe, Asia-Pacific, Middle East and Africa, South and Central America), 2021 – 2031
-
Apr 2026
Digital Visa Services Market
Digital Visa Services Market Size, Share & Analysis Report By Type (Individual Travelers, Group Travelers), By Application (Tourism, Business Travel, Others), and Geography (North America, Europe, Asia-Pacific, Middle East and Africa, South and Central America), 2021 – 2031