
Data Observability Market Summary:
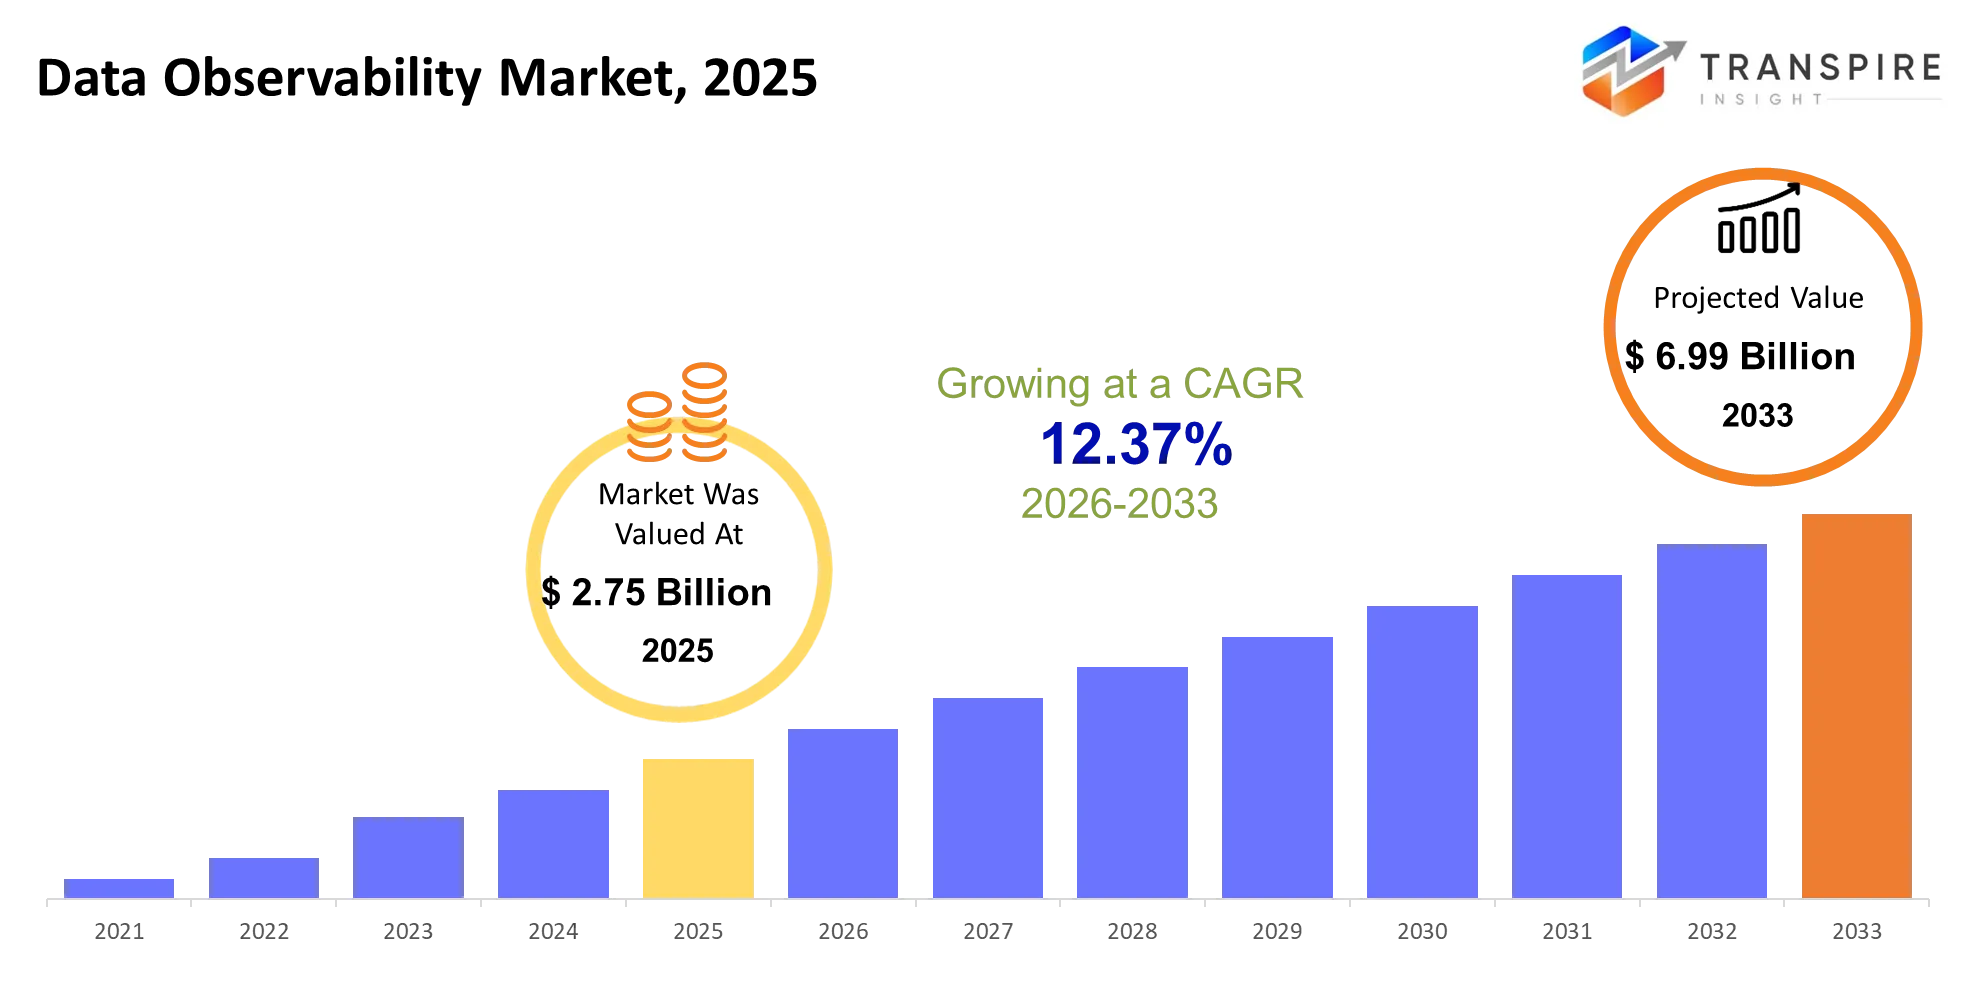
As per Transpire Insight, the Data Observability Market size is estimated at USD 2.75 billion in 2025 and is anticipated to reach USD 6.99 billion by 2033, growing at a CAGR of 12.37%from 2026 to 2033.
The Data Observability Market is becoming more important as companies try to keep their data reliable across cloud platforms analysis systems and artificial intelligence tools. Observability tools help businesses find data late updates, broken data flows and sudden changes before these issues hurt reports or business choices. In the three to five years the market has moved from old ways of checking data quality to continuous monitoring, automatic problem detection and full tracking of data from start to finish. More people are using data warehouses and new types of AI, which has made the need for solid data systems even higher. A big change is adding AI tools to watch over data processes. As more companies use AI in their work this has become a reason to act because bad data can make models less accurate and hurt business results. Because of this businesses are spending money on observability tools to cut down on fixing problems make data rules stronger and feel more sure, about the information they use.
Data Observability Market Size & Forecast:
- Market Size 2025: USD 2.75 Billion
- Expected Market Value (2033): USD 6.99 Billion
- Forecast CAGR (2026–2033): 12.37%
- Leading Region in 2025: North America
- Fastest Growing Region: Asia Pacific
- Key Company Profiles: Datadog, Dynatrace, Splunk, Monte Carlo, Bigeye, Acceldata, IBM, New Relic, Informatica, Databand, Soda, Metaplane, Anomalo, Collibra, Observe
Key Market Insights:
Market trends are pointing towards platforms that incorporate data quality monitoring, visibility of pipelines, and automated incident investigation. AI-driven technology and the demand for reliable enterprise data are influencing product design and procurement processes.
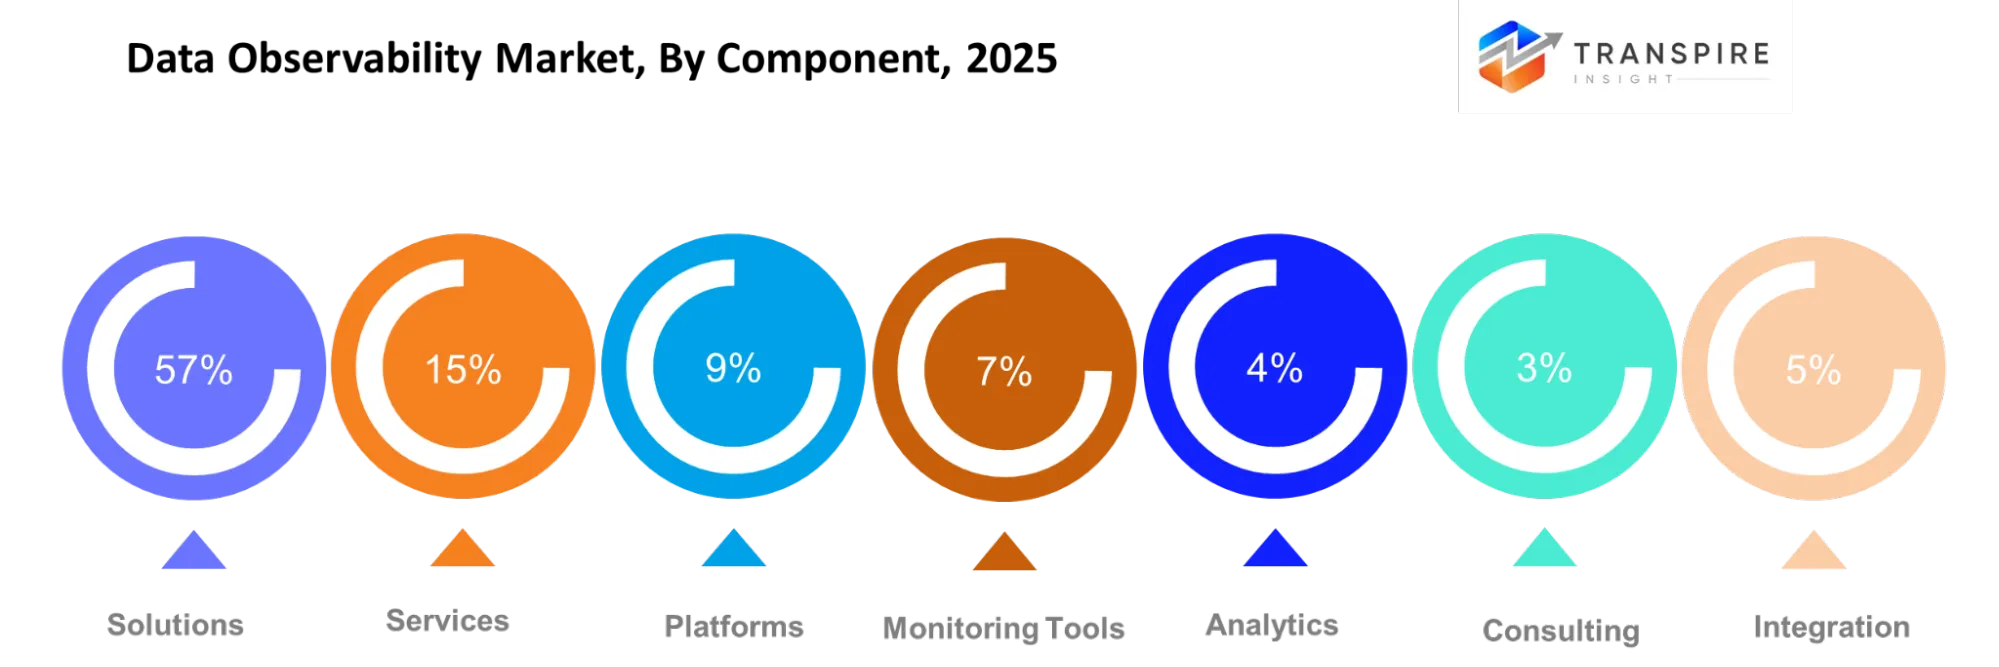
- The solutions category constitutes 56.8% of the component segment because of the necessity of dedicated software for detecting data quality problems and keeping track of pipelines' health.
- AI-driven observability will experience a CAGR of 22.4% due to the necessity of monitoring AI agents, inputs to models, and outputs from models.
- The platforms segment contains 9.0% and reflects the need for integrated environments that can unite data quality checks, lineage, alerts, and troubleshooting.
- Monitoring tools make up 7.0% of the component segment and reflect the need to move toward continuous detection and away from periodic manual validation.
- Analytics is represented by 4.8% and reflects the necessity of turning data health signals into operational insights.
- The integration segment contains 2.2% and reflects the need for connecting observability products to existing databases, warehouses, and analytics tools.
What are the Key Drivers, Restraints, and Opportunities in the Data Observability Market?
Drivers:
Cloud warehouses, streaming infrastructure, business applications, and machine learning pipelines are leading to a more distributed data environment at enterprise organisations. In addition to slowing data quality checks, this environment introduces the risk of corrupted reports or failed pipelines- issues which have been exacerbated by the rise of generative AI, whose outputs rely on trustworthy source data. Consequently, organisations are turning to observability platforms to flag anomalies sooner and minimise investigation time.
Restraints:
The high cost of implementation and integration issues remain barriers to adoption, especially for smaller firms. Linking monitoring systems to legacy databases, multiple cloud environments, and other governance systems may necessitate technical expertise and involve extensive configuration.
Opportunities:
AI-powered troubleshooting, automation of monitoring setup and blending a comprehensive view of data and AI systems provides a lot of room for expansion. Vendors have an edge over competitors by minimising the creation of individual rules and enabling the connection of issues to their root causes. Monte Carlo launched observability agents to expedite troubleshooting and monitoring workflows.
|
Driver |
Relative Impact on Growth (%) |
Geographic Relevance |
Impact Timeline |
Demand Strength |
Growth Mechanism (5–10 words) |
Key Beneficiaries (5–10 words) |
Major Constraint (5–10 words) |
|
Growing Complexity of Cloud Data Infrastructure |
27% |
North America, Europe, Asia-Pacific |
Short-term (≤2 years) |
High |
Monitors distributed pipelines, detects anomalies, and prevents data failures. |
Observability platforms, cloud providers, enterprise data engineering teams. |
Complex integrations increase deployment costs and implementation time. |
|
Rising Adoption of AI and Generative AI |
23% |
North America, Asia-Pacific, Europe |
Short-term (≤2 years) |
High |
Validates AI data inputs, detects drift, and improves reliability. |
AI platform vendors, observability providers, machine learning teams. |
Unpredictable AI workloads increase monitoring complexity and costs. |
|
Increasing Demand for Data Quality and Reliability |
20% |
North America, Europe, Asia-Pacific |
Short-term (≤2 years) |
High |
Identifies missing, delayed, inconsistent, and inaccurate enterprise data. |
Data observability vendors, analytics teams, business intelligence providers. |
Limited data engineering expertise slows platform adoption. |
|
Regulatory Compliance and Data Governance Requirements |
16% |
Europe, North America, Asia-Pacific |
Medium-term (2–4 years) |
High |
Improves data lineage, auditability, traceability, and compliance reporting. |
Governance software vendors, regulated enterprises, compliance service providers. |
Fragmented regulations and legacy systems complicate compliance implementation. |
|
Enterprise Investment in Real-Time Analytics and Data-Driven Operations |
14% |
Asia-Pacific, North America, Europe |
Medium-term (2–4 years) |
High |
Detects pipeline disruptions early, supporting faster operational decisions. |
Analytics vendors, cloud service providers, digital enterprises. |
Budget constraints and uncertain returns delay purchasing decisions. |
|
Total |
100% |
— |
— |
— |
— |
— |
— |
What Has the Impact of Artificial Intelligence Been on the Data Observability Market?
The use of AI technologies is transforming the data observability space globally, as the technology enables businesses to find, explore, and fix issues with data, which does not require much human input. Machine learning algorithms are able to learn the normal behaviour of data in terms of its size, freshness, distribution, and pipelines. Anomalies in real-time behaviour of the system are reported to appropriate teams when they deviate from learned normality. The technique is especially applicable to enterprises, which have many datasets and thus cannot use manually configured rules.AI is being used in root cause analysis of data problems by exploring relationships between different data sources, transformation jobs, pipeline dependencies, and downstream applications. Some tools incorporate AI agents, which suggest appropriate monitoring rules, investigate problems, and point users to possible solutions. Predictive capabilities may enable teams to detect potential reliability issues before they interfere with dashboards, analytics products, or AI application functionality. It is believed that such an improvement might make investigation cycles shorter and allow data engineers to focus on more valuable work. AI-driven observability faces certain limitations. Integration complexity, implementation costs, low-quality training data, and inaccuracy of recommendations are among those limitations
Instance:
In September 2025, Agent Observability was introduced by Monte Carlo to gain visibility into data and AI systems to fix any reliability problems. It shows the rising importance of AI, which is raising the need for observability solutions for businesses to keep their data and AI results accurate.
https://montecarlo.ai/blog-agent-observability-announcement
Key Market Trends:
Data observability is moving from being a data engineering concern to becoming an enterprise-wide reliability practice. This shift is reflected in vendors linking data observability with artificial intelligence governance, operational automation, and risk management.
- Companies are moving from periodic verification to continuous verification of freshness, size, and changes in schema.
- Providers are integrating data quality, lineage, alerts, and troubleshooting to streamline processes.
- Machine learning is allowing teams to spot anomalies and incidents early. Monitoring is being extended to documents, PDFs, chat logs, and other data used by enterprise AI systems.
- Advanced tools can analyse root causes of likely incidents and suggest remediation.
- Enterprises require consistent monitoring of public clouds, private infrastructure, and on-premises databases.
- Data professionals are increasingly focusing on the effect of failures on reporting, customer service, finance, and AI.
- Providers are integrating monitoring of model behaviour, AI agents, responses, and performance.
Data Observability Market Segmentation
By Component:
The solutions category accounts for 56.8% of the market, indicating its dominance. This is because there is a necessity for the software that consistently checks data health, detects any anomalies and finds out the problems related to data pipelines. The services category has a market share of 15.5%, while platforms have a market share of 9.0%. Monitoring tools account for 7.0%, analytics accounts for 4.8%, consulting stands at 3.2%, integration is 2.2%, and support is at 1.5%.
By Data Type:
The solution set includes structured data, unstructured data, semi-structured data, streaming data, batch data, metadata, machine data, and others. While structured data is vital for BI, financial systems, and operational databases, unstructured data and streaming data are increasingly important as organisations roll out more generative AI tools and streamline analytics. Metadata is especially useful for tracking data provenance, dependency relationships, and quality issues; future solutions should be able to monitor different formats without erecting duplicate operational data pipelines.
By Deployment:
Types of deployments covered are the cloud, on-premises, hybrid cloud, multi-cloud, SaaS, private cloud, public cloud, and edge. Cloud and SaaS deployments are attractive to organisations that want flexible deployments and to have less to maintain infrastructure and other aspects of the deployment. Deployments in hybrid cloud and multi-cloud are attractive to those organisations because data could move between providers and on-premises. Deployments on-premises and in private cloud are relevant when there is a need for greater control over infrastructure or jurisdictions with data residency and security requirements. Some edge monitoring could become critical as connected devices produce data where it is generated.
By Organisation Size:
The market that the vendors serve includes large enterprises, SMEs, start-ups, government, financial, health care, retail, and other organisations. Large enterprises may require large amounts of monitoring across distributed data stores and across multiple organisational units. SMEs and start-ups may be attracted to low-cost, simple-to-implement solutions that reduce the reliance on specialised engineering teams. Government, banking, and health-care organisations require traceability, reliable reporting, and controls for their environments and compliance requirements.
By Applications:
Data Quality Monitoring, Pipeline Monitoring, Data Lineage, Incident Management, Performance Monitoring, Data Governance, Anomaly Detection and More. Data Quality Monitoring finds data gaps, duplicates, miscalculations and out-of-date data; Pipeline Monitoring is used to detect breaks and delays; Data Lineage enables tracing data flows to reports and applications downstream; Incident Management offers case management and root cause analysis, and Anomaly Detection finds anomalies and trends. This list is supposed to merge even more, as companies will keep requesting end-to-end monitoring to find a single product to address all their needs instead of several disconnected solutions.
By End Users:
The market is served by BFSI, IT and Telecommunications, Healthcare, Retail, Manufacturing, Media, Government and Education sectors. BFSI uses observability tools for proper reporting, transaction analysis and risk management. IT and Telecommunications sectors require visibility into large-scale data pipelines and digital services. Health organisations depend on data accuracy and analytics; retail organisations use reliable data for inventory management and planning, customer insights and demand forecasting. The manufacturing sector may use observability for data on production processes and machine telemetry, and media, government and education organisations may improve their reporting and operations with observability.
What are the Key Use Cases Driving the Data Observability Market?
This use case is concerned with automated data quality and pipeline monitoring that makes it possible for the Solutions part to exist. Companies utilise this kind of technology to detect missing data, late data, schema changes, and inconsistencies in the dataset before any effect on business intelligence reports or decisions are made. There are also other use cases like data lineage, anomaly detection, and incident management for BFSI, healthcare, retail, and IT services. Banks will be able to get to the root cause of any discrepancies in their transaction data, while the healthcare sector will be able to monitor data that is used for reporting and analysis. The retail industry will be able to detect any unreliable feed in its inventory before there is an effect on the demand planning. There are other future use cases like monitoring of generative AI systems, retrieval pipelines, and AI agent output.
|
Report Metrics |
Details |
|
Market size value in 2025 |
USD 2.75 Billion |
|
Market size value in 2026 |
USD 3.09 Billion |
|
Revenue forecast in 2033 |
USD 6.99 Billion |
|
Growth rate |
CAGR of 12.37% from 2026 to 2033 |
|
Base year |
2025 |
|
Historical data |
2021 - 2024 |
|
Forecast period |
2026 - 2033 |
|
Report coverage |
Revenue forecast, competitive landscape, growth factors, and trends |
|
Regional scope |
United States; Canada; Mexico; United Kingdom; Germany; France; Italy; Spain; Denmark; Sweden; Norway; China; Japan; India; Australia; South Korea; Thailand; Brazil; Argentina; South Africa; Saudi Arabia; United Arab Emirates |
|
Key company profiled |
Datadog, Dynatrace, Splunk, Monte Carlo, Bigeye, Acceldata, IBM, New Relic, Informatica, Databand, Soda, Metaplane, Anomalo, Collibra, Observe |
|
Customization scope |
Free report customization (country, regional & segment scope). Avail customized purchase options to meet your exact research needs. |
|
Report Segmentation |
Component (Solutions, Services, Platforms, Monitoring Tools, Analytics, Consulting, Integration, Support)Data Type (Structured Data, Unstructured Data, Semi-Structured Data, Streaming Data, Batch Data, Metadata, Machine Data, Others)Deployment (Cloud, On-Premise, Hybrid Cloud, Multi-Cloud, SaaS, Private Cloud, Public Cloud, Edge)Organization Size (Large Enterprises, SMEs, Startups, Government, Financial Institutions, Healthcare Organizations, Retailers, Others)Application (Data Quality Monitoring, Pipeline Monitoring, Data Lineage, Incident Management, Performance Monitoring, Data Governance, Anomaly Detection, Others)End User (BFSI, IT & Telecom, Healthcare, Retail, Manufacturing, Media, Government, Education) |
Which Regions are Driving the Data Observability Market Growth?
North America:
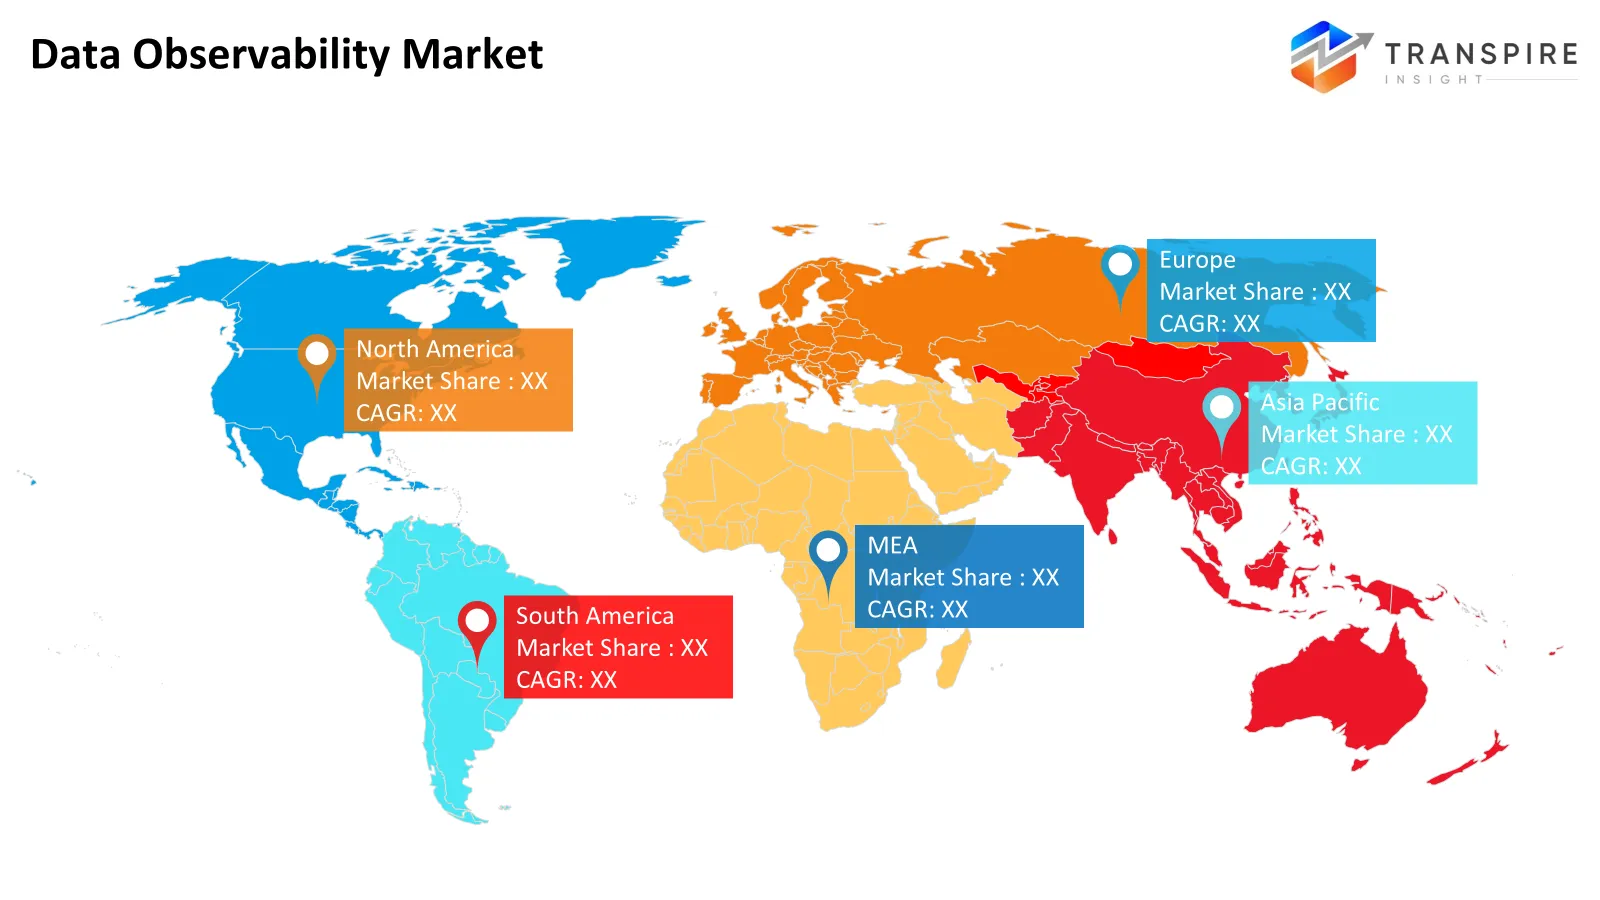
North America leads the market with a share of 43.7%, which is attributed to its existing cloud computing ecosystem, enterprise software market, and technology companies. Firms operating in financial services, healthcare, and e-commerce need precise data for analytics and reporting, as well as the use of artificial intelligence. The presence of observability vendors and cloud computing platform providers helps in product development and enterprise adoption. Investments in AI infrastructure and data governance are anticipated to boost the demand for the solution in the region.
In April 2025, Datadog made a deal to acquire Metaplane to enhance data observability services that help companies detect problems with data quality and ensure data reliability.
Europe:
Europe accounts for 28.2%. The market is characterised by the enterprise IT infrastructure that is already present and the requirement of being accountable for data management and governance. Firms working in different countries have to manage a complicated data environment while remaining compliant with the laws. It makes it easy for observability solutions to flourish.
In May 2025, Monte Carlo introduced EU hosting for its Data and AI Observability Platform, which assists European companies in complying with data residency regulations.
https://montecarlo.ai/blog-monte-carlo-announces-eu-hosting-option
Asia Pacific:
The Asia Pacific region constitutes 19.8% of the total supplied regional distribution and has been stated as the fastest-growing region, having a CAGR of 20.1%. Increasing use of cloud, digitised services, and artificial intelligence (AI) is one reason that is creating the demand for a reliable data infrastructure in this region. Companies upgrading their systems can leverage observability technology to maintain quality data without doing everything manually. There is scope for scalable platforms and regional implementation partners from sectors like financial services, manufacturing, telecom, and e-commerce.
In October 2025, Cisco made Splunk Observability Cloud available on AWS in Singapore, thus making it possible for companies in Asia-Pacific to use observability solutions.
Who are the Key Players in the Data Observability Market and how do they compete?
Competition in the data observability market revolves around the precision of detection, scope of integration, speed of troubleshooting, flexibility of deployment, and capability to link data reliability to AI performance. The vendors compete with each other based on automated monitoring, lineage visualisation, enterprise governance, and integration with cloud data platforms. Competitors also compete on implementation complexity, pricing, and catering to the needs of customers with different infrastructure requirements. Monte Carlo concentrates on end-to-end data and AI reliability that includes monitoring AI agent inputs and outputs. The vendor follows the product strategy of integrated observability and automated investigation that helps enterprises manage risks related to data and AI through an integrated platform. The September 2025 Agent Observability release demonstrates the vendor’s focus. Datadog is moving from application and infrastructure monitoring to data observability.The vendor acquired Metaplane, which helped Datadog improve capabilities in data quality monitoring and column-level lineage. This strategy allows customers to find a way to link data monitoring to observability workflows.
Data Observability Market Companies
- Datadog
- Dynatrace
- Splunk
- Monte Carlo
- Bigeye
- Acceldata
- IBM
- New Relic
- Informatica
- Databand
- Soda
- Metaplane
- Anomalo
- Collibra
- Observe
|
Company |
Est. Revenue Share Range |
Key Offerings |
Strategic Positioning |
Geographic Strength |
Technology Focus |
|
Datadog |
Estimated 8–15% |
Data Streams Monitoring, Jobs Monitoring, Data Quality Monitoring, Data Lineage |
Unified observability platform for data and infrastructure |
North America, Europe, Asia Pacific |
ML anomaly detection and end-to-end lineage |
|
Monte Carlo |
Estimated 7–13% |
Data Observability Platform, quality monitoring, field-level lineage, incident management |
Specialized platform focused on enterprise data reliability |
North America, Europe, Asia Pacific |
Automated anomaly detection and lineage intelligence |
|
Dynatrace |
Estimated 5–10% |
Dynatrace Intelligence, log analytics, data analytics, causal observability |
Enterprise observability with AI-driven root-cause analysis |
North America, Europe, Asia Pacific |
Causal AI and automated root-cause analysis |
|
IBM |
Estimated 5–10% |
IBM Databand, pipeline monitoring, data quality monitoring, data governance |
Enterprise data integration and hybrid data management |
North America, Europe, Asia Pacific |
AI-assisted monitoring and hybrid data integration |
|
Informatica |
Estimated 5–9% |
IDMC Data Quality and Observability, CLAIRE AI, data profiling, lineage |
Integrated enterprise data quality and management platform |
North America, Europe, Asia Pacific |
AI-powered profiling and metadata intelligence |
|
Acceldata |
Estimated 4–8% |
Data Observability Cloud, reliability policies, reconciliation, pipeline monitoring |
Full-stack observability for complex enterprise data environments |
North America, Asia Pacific, Europe |
Data telemetry and intelligent anomaly detection |
|
Bigeye |
Estimated 3–7% |
Data Monitoring, Autometrics, Data Lineage, incident resolution |
Automated data quality monitoring and diagnosis |
North America, Europe, Asia Pacific |
ML anomaly detection and automated metric generation |
|
New Relic |
Estimated 2–6% |
Telemetry monitoring, log analytics, pipeline visibility, alerting |
Developer-centric observability with data pipeline visibility |
North America, Europe, Asia Pacific |
Telemetry correlation and real-time analytics |
|
Soda |
Estimated 2–5% |
Soda platform, data quality monitoring, data contracts, pipeline testing |
Developer-friendly data quality and observability platform |
North America, Europe, Asia Pacific |
Anomaly detection and data contract automation |
|
Anomalo |
Estimated 1–4% |
Data quality monitoring, anomaly detection, root-cause analysis, alerting |
Specialized platform for complex data quality issues |
North America, Europe, Asia Pacific |
Unsupervised machine learning and anomaly diagnosis |
Recent Development News
- In February 2026, Actian announced updates to its data intelligence and data observability solutions as part of the Winter 2026 product launch. This included observability agents, a Model Context Protocol server, enhanced platform interoperability, and XML and PDF monitoring capabilities. These innovations reflect the trend toward AI-powered data validation and more automation in governance within enterprises. https://www.actian.com/blog/product-launches/winter-2026-launch/
- In September 2025, Monte Carlo released Agent Observability. This was a solution aimed at offering visibility into data pipelines and AI agents in order to help companies identify, troubleshoot, and solve issues with the reliability of AI inputs and outputs. This innovation reflects the growing focus on monitoring the complete data and AI pipeline rather than separating out data quality and AI performance. https://montecarlo.ai/blog-agent-observability-announcement
What Strategic Insights Define the Future of the Data Observability Market?
The data observability market in the future will be determined by the ability of vendors to integrate data reliability, AI governance, and decision-making into one system. Traditional monitoring will be important. Customers will demand not only information about the issue but also the reasons for its occurrence, the impacted systems, and the possible ways to solve the problem. AI-based observability is an important area of development for vendors as companies implement more AI agents and data-intensive applications. Another potential risk is connected with the increasing complexity of monitoring systems. Too many alerts, integration difficulties, and inaccurate recommendations can negatively affect customer satisfaction and increase the cost of operation. In such a case, vendors should focus on explainable detection, faster incident resolution, and compatibility with the existing systems. In terms of strategy, the vendors should pay attention to the development of AI-based root cause analysis, monitoring of unstructured data, and open integrations. Enterprises should consider the business value, security needs, and the total cost of ownership when choosing a solution.
Key Segmentations are:
Component
- Solutions
- Services
- Platforms
- Monitoring Tools
- Analytics
- Consulting
- Integration
- Support
Data Type
- Structured Data
- Unstructured Data
- Semi-Structured Data
- Streaming Data
- Batch Data
- Metadata
- Machine Data
- Others
Deployment
- Cloud
- On-Premise
- Hybrid Cloud
- Multi-Cloud
- SaaS
- Private Cloud
- Public Cloud
- Edge
Organization Size
- Large Enterprises
- SMEs
- Startups
- Government
- Financial Institutions
- Healthcare Organizations
- Retailers
- Others
Application
- Data Quality Monitoring
- Pipeline Monitoring
- Data Lineage
- Incident Management
- Performance Monitoring
- Data Governance
- Anomaly Detection
- Others
End User
- BFSI
- IT & Telecom
- Healthcare
- Retail
- Manufacturing
- Media
- Government
- Education
By Regional Analysis
North America
- US
- Canada
- Mexico
Europe
- Germany
- UK
- France
- Italy
- Spain
- Russia
- Rest of Europe
Asia Pacific
- China
- Japan
- India
- South Korea
- Australia
- Rest of Asia Pacific
South America
- Brazil
- Argentina
- Rest of South America
Middle East & Africa
- UAE
- Saudi Arabia
- Qatar
- South Africa
- Rest of the Middle East & Africa
Frequently Asked Questions
Find quick answers to common questions.
The data observability market size was valued at USD 2.75 billion in 2025 and is poised to reach USD 6.99 billion by 2033, expanding at a 12.37% CAGR.
Key segments for the data observability market are Component (Solutions, Services, Platforms, Monitoring Tools, Analytics, Consulting, Integration, Support)Data Type (Structured Data, Unstructured Data, Semi-Structured Data, Streaming Data, Batch Data, Metadata, Machine Data, Others)Deployment (Cloud, On-Premise, Hybrid Cloud, Multi-Cloud, SaaS, Private Cloud, Public Cloud, Edge)Organization Size (Large Enterprises, SMEs, Startups, Government, Financial Institutions, Healthcare Organizations, Retailers, Others)Application (Data Quality Monitoring, Pipeline Monitoring, Data Lineage, Incident Management, Performance Monitoring, Data Governance, Anomaly Detection, Others)End User (BFSI, IT & Telecom, Healthcare, Retail, Manufacturing, Media, Government, Education).
Growth is primarily driven by increasing adoption of cloud computing, rising demand for real-time data monitoring, growing use of AI and machine learning, the need for improved data quality, and increasing investments in data analytics and automated anomaly detection solutions.
The market is led by major manufacturers including by Datadog, Dynatrace, Splunk, Monte Carlo, Bigeye, Acceldata, IBM, New Relic, Informatica, Databand, Soda, Metaplane, Anomalo, Collibra, Observe.
North America leads the world’s data observability market with a 43.7% share due to its advanced cloud infrastructure, presence of major tech companies, increased use of artificial intelligence and big data analytics, and growing demand for real-time data monitoring and data quality management.
Opportunities in the data observability market include the adoption of AI-based observability solutions, growing demand for cloud-based observability platforms, growth in real-time analytics of data, increased investment in data quality management, and the rising demand for data governance and data anomaly detection.
- Datadog
- Dynatrace
- Splunk
- Monte Carlo
- Bigeye
- Acceldata
- IBM
- New Relic
- Informatica
- Databand
- Soda
- Metaplane
- Anomalo
- Collibra
- Observe
About the Authors

Mayur Shinde
I am Mayur Shinde, a Senior Research Analyst at Transpire Insight, specializing in the Automotive & Transportation and Information & Communication Technology (ICT) Industry. My work focuses on analyzing emerging market trends, technological advancements, competitive landscapes, and industry developments to deliver accurate, data-driven insights. I am passionate about transforming complex market information into clear, actionable content that helps businesses, professionals, and decision-makers stay informed and make confident strategic decisions.

Chakradhar Khansole
Chakradhar serves as the Research Director at Transpire Insight, bringing over 8 years of experience in technology, innovation, and strategic market intelligence. He specializes in transforming complex market data into actionable business insights that enable organizations to make informed, growth-oriented decisions. Recognized for his strategic vision and analytical expertise, Chakradhar leads high-impact research initiatives, delivering comprehensive market assessments, competitive intelligence, and forward-looking industry analysis.
Recently Published Reports
-
Apr 2026
3D Optical Profiler Market
3D Optical Profiler Market Size, Share & Analysis Report By Type (Desktop 3D Optical Profiler, and Portable 3D Optical Profiler), By Technology (Confocal Technology, and White Light Interference), By End-Use Industry (Manufacturing, Research Institutions, Automotive, Aerospace and Defense, Medical Devices, and Other), and Geography (North America, Europe, Asia-Pacific, Middle East and Africa, South and Central America), 2021 - 2031
-
Apr 2026
Depth Sensor Market
Depth Sensor Market Size, Share & Analysis Report By Type (Infrared Depth Sensors, Time-of-Flight (ToF) Sensors, Stereo Vision Sensors, Structured Light Sensors, Ultrasonic Depth Sensors), By Application (Automotive, Robotics, Gaming, Consumer Electronics, Industrial Automation, Healthcare, Security & Surveillance, Others), By End Users (Automotive Manufacturers, Consumer Electronics Companies, Healthcare Providers, Industrial Companies, Security Agencies, Gaming Companies, Robotics Companies, Others), and Geography (North America, Europe, Asia-Pacific, Middle East and Africa, South and Central America), 2021 – 2031
-
Apr 2026
Digital Manufacturing Market
Digital Manufacturing Market Size, Share & Analysis Report By Component (Hardware, Software, and Services), By Technology (Robotics, 3D Printing, Internet of Things (IoT), and Others), By Application (Automotive and Transportation, Aerospace and Defense, Consumer Electronics, Industrial Machinery, and Others), By Process Type (Computer-Based Designing, Computer-Based Simulation, Computer 3D Visualization, Analytics, and Others), and Geography (North America, Europe, Asia-Pacific, Middle East and Africa, South and Central America), 2021 – 2031
-
Apr 2026
Digital Visa Services Market
Digital Visa Services Market Size, Share & Analysis Report By Type (Individual Travelers, Group Travelers), By Application (Tourism, Business Travel, Others), and Geography (North America, Europe, Asia-Pacific, Middle East and Africa, South and Central America), 2021 – 2031