
Market Summary
The global Agriculture Analytics market size was valued at USD 1.77 billion in 2025 and is projected to reach USD 4.47 billion by 2033, growing at a CAGR of 12.30% from 2026 to 2033. Not far behind, fresh ways farmers use numbers now shape how crops grow, and land gets managed. A twist comes from smart tools, cameras in fields, invisible signals, and brains that learn all, linking up without delay. Outcomes shift fast when weather wobbles or hunger risks climb. Backed quietly by policy moves, digital steps forward gain ground where soil and sky meet demand.
Market Size & Forecast
- 2025 Market Size: USD 1.77 Billion
- 2033 Projected Market Size: USD 4.47 Billion
- CAGR (2026-2033): 12.30%
- North America: Largest Market in 2026
- Asia Pacific: Fastest Growing Market

To learn more about this report,  Download Free Sample Report
Key Market Trends Analysis
- The North America market share is estimated to be approximately 40% in 2026. Fueled by tech-savvy farms, North America sits ahead in its strong network of data tools that shape how crops are tracked. A steady push into smart farming keeps decision-making sharp across vast rural zones.
- Farms across the United States are expanding fast smart tech like artificial intelligence guides decisions on vast plots. Data flows through cloud systems, helping operators track crops with precision. Machines talk to each other using wireless networks, adjusting irrigation before the soil dries out. Profit is not the only result; efficiency reshapes how food is grown at scale.
- Fueled by swelling appetite for food, the Asia Pacific surges ahead. Government pushes add momentum across rural landscapes. Small plots and large fields alike now tap affordable data tools. Growth here outpaces every other corner of the world.
- Software shares approximately 65% in 2026. Farmers turn to software first, and pressure to track yields pushes quick uptake. Data tools spread fast once harvest numbers hit screens. Pressure grows where fields meet spreadsheets.
- Out here, artificial intelligence grows quicker than anything else in tech. Because machines that learn can guess what farms need before problems start. These smart systems help farmers make better decisions using facts pulled from data. Predictions shape choices, making each step on the land more precise. What counts is how well tools adapt to real conditions out in the fields.
- Big farms lead in uptake, thanks to their size, opening doors to resources. Money moves more easily there, making new tools more reachable.
- Farming gets smarter where exactness matters most - this method leads because it cuts waste while lifting harvests. Out front, not by chance but through careful tweaks that grow more from less.
Farmers now rely on number-crunching systems that pull details from fields, machines, and skies, each piece feeding smarter choices. These setups mix digital dashboards with live sensors plus historical patterns drawn from earth and rain. Instead of guessing, growers spot trends through processed signals gathered by gadgets parked in tractors or stuck in dirt rows. Outcomes shift when decisions follow evidence rather than habit, the right feed at the right hour, and less waste under open sun. Tools like these shape responses before storms hit or pests move in. Results show up in fuller bins, healthier plots, and tighter budgets. Precision is not just measured; it becomes routine.
Fueled by growing hunger worldwide alongside tighter space for crops and fewer hands to work them, farms now turn to data more often. Instead of guessing, growers rely on forecasts and live updates that sharpen harvests while tackling bugs or sickness in plants. These digital aids fit neatly into exact-farming strategies, trimming waste through smarter supply handling and less reliance on synthetic sprays. Even irrigation gets a tune-up when numbers guide decisions.
Out in fields where tractors once ruled alone, silent networks now hum beneath the surface. Sensors tucked into soil whisper updates through invisible threads. Information flows not in bursts but steady streams, shaping choices before problems arise. Machines learn patterns without being told every step. Decisions come faster because delays fade when data leads. Farms stretch wider yet feel smaller thanks to constant digital touchpoints. Automation does not replace hands - it shifts their work toward smarter goals. Profit is not chased blindly; it grows from precision. What used to take guesswork now runs on quiet logic.
Out in fields far and wide, number-crunching tools find their way into daily farm routines because support flows from public policies. Where tech roots ran deep long ago, think across North America or much of Europe, these systems now hum along smoothly. Over in the Asia Pacific, plus parts of Latin America, fresh interest grows fast, even though starting later. Day by day, sorting through data shifts from novelty to necessity on working land. This quiet shift sharpens output, eases strain on nature, and helps withstand shocks, too. Farming everywhere begins leaning hard on insights pulled from patterns nobody saw clearly before.
Agriculture Analytics Market Segmentation
By Component
- Software
Farming tools live inside software, where numbers turn into choices. Insights grow from patterns machines detect over time. Operations shift smoothly when guided by digital oversight. Decisions gain clarity through organized information flow.
- Services
Solutions begin with advice on how they fit your needs, which matters most. One step at a time, pieces connect where insight meets structure. Putting systems into motion follows a clear direction. Help stays close when things shift or stall.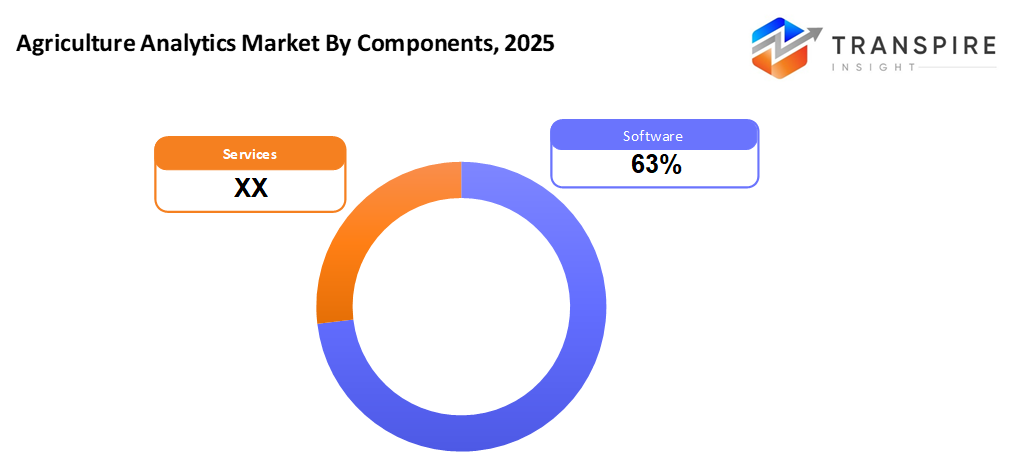
To learn more about this report, Download Free Sample Report
By Technology
- Big Data Analytics
Farming choices get sharper when massive data collections are shaped by analysis. Decisions grow clearer through number patterns pulled from vast harvest records.
- Artificial Intelligence & Machine Learning
Suddenly, machines learn patterns in farm data to guess crop outcomes. Not just guesses, they adjust based on bugs spotted early. Often, water or fertilizer needs shift; these systems track those changes quietly. Insight pops up where least expected, like soil fatigue before harvest.
- IoT & Sensors Analytics
From sensors out in the field, live data flows in patterns that emerge once it's pieced together. Devices report what they detect, moment by moment. Information gets sorted, then made clear through analysis. What happens shows up right away, no delay.
- Cloud Computing & Data Platforms
Farm information lives together online instead of scattered everywhere. Seeing it clearly happens through dashboards viewable from anywhere. Accessing details from far away works smoothly when needed most.
By Farm Type
- Large Farms
Big fields stretch under careful watch, where machines track every detail to keep work flowing smoothly.
- Medium Farms
Semi-commercial farms adopting selective analytics solutions.
- Small Farms
Farming plots on a modest scale rely on basic data methods that keep expenses low. These family-run spots make smart choices without fancy systems. The tools they use fit tight budgets yet still deliver useful insights. Decisions come easier when numbers guide the way. Simplicity wins where resources are limited.
By Application
- Crop Monitoring & Yield Prediction
Farm fields are watched closely so harvest amounts can be guessed ahead of time.
- Precision Agriculture
Farming smarter means using less water, better soil care, one thing at a time. Each choice shapes how well crops grow, behind the scenes.
- Risk & Pest Management
Predicting trouble before it spreads, spotting bugs, sickness, or bad weather fast. Early warnings keep crops safer through timely alerts.
- Supply Chain & Market Analytics
Predicting demand gets easier when data guides decisions. Efficiency grows through smarter pricing moves. Distribution paths adjust smoothly over time. Insights shape how products move from source to buyer.
Regional Insights
Farms across North America already rely on data tools, thanks to vast fields where tech fits naturally. Out here, machines talk to each other through sensors while satellite views guide planting choices. In the United States and Canada, most big operations pull insights from software that runs on distant servers, updated nonstop. Decisions come quicker now because alerts pop up when the soil dries or pests arrive. Even tractors adjust seeding rates mid-field without human orders. Over time, Mexican growers began using similar systems after new rules encouraged upgrades. Some rural areas got funding so small teams could test smart irrigation linked to weather forecasts.
Farming in Europe keeps moving forward, due to rules that push cleaner practices and smarter land use. Instead of just the top nations, others are now bringing in data tools to get better harvests with less waste. Big players rely on number-crunching systems to track crops, guess outputs, and fine-tune water and fertilizer needs. Smaller regions follow close behind, aiming to cut expenses through sharper planning. Money from Brussels flows into tech-driven farms, giving fresh momentum to modern methods across rural areas.
China, Japan, and Australia push growth across the Asia Pacific as hunger for food grows alongside state-supported tech in farming. Small and mid-sized farms in India, Southeast Asia, and South Korea now lean into cheaper data tools more each year. Brazil and Argentina show stronger interest in digital methods that track field outcomes with precision. The United States and South Africa see similar shifts in spending on systems that guide planting, watering, and harvesting. New habits take root where soil meets software, quietly changing how crops are managed.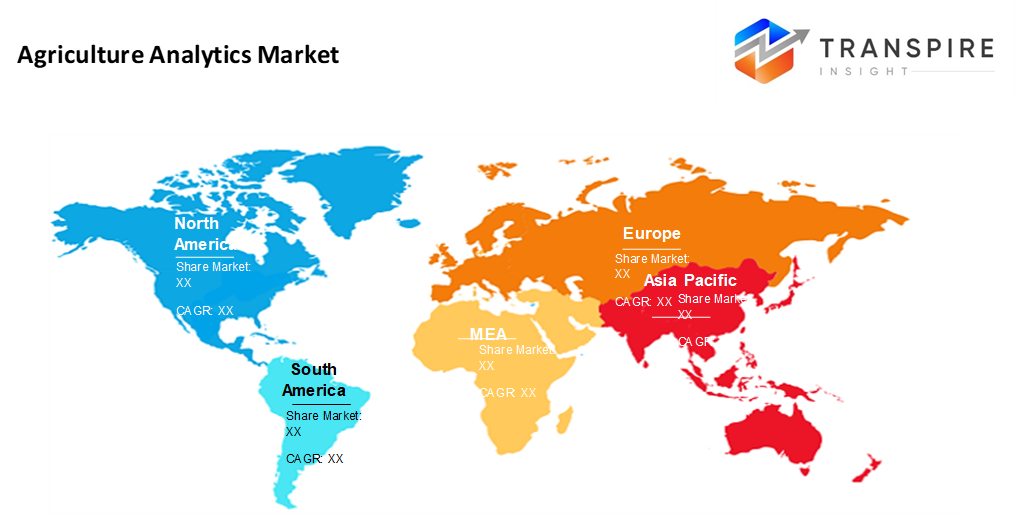
To learn more about this report, Download Free Sample Report
Recent Development News
- February 25, 2025 – Yamaha Motor launched Yamaha Agriculture to advanced autonomous farming solution.
(Source: https://igrownews.com/yamaha-agriculture-latest-news/
|
Report Metrics |
Details |
|
Market size value in 2025 |
USD 1.77 Billion |
|
Market size value in 2026 |
USD 1.98 Billion |
|
Revenue forecast in 2033 |
USD 4.47 Billion |
|
Growth rate |
CAGR of 12.30% from 2026 to 2033 |
|
Base year |
2025 |
|
Historical data |
2021 – 2024 |
|
Forecast period |
2026 – 2033 |
|
Report coverage |
Revenue forecast, competitive landscape, growth factors, and trends |
|
Regional scope |
North America; Europe; Asia Pacific; Latin America; Middle East & Africa |
|
Country scope |
United States; Canada; Mexico; United Kingdom; Germany; France; Italy; Spain; Denmark; Sweden; Norway; China; Japan; India; Australia; South Korea; Thailand; Brazil; Argentina; South Africa; Saudi Arabia; United Arab Emirates |
|
Key company profiled |
Trimble Inc., IBM Corporation, Wipro, SAP SE, Iteris, Taranis, Oracle Corporation, Xylem Inc., Precision Hawk, Gro Intelligence, Granular, John Deere, Microsoft Corporation, AGCO Corporation, Arable Labs, FarmLogs, and AG Leader Technology |
|
Customization scope |
Free report customization (country, regional & segment scope). Avail customized purchase options to meet your exact research needs. |
|
Report Segmentation |
By Component (Software, Services), By Technology(Big Data Analytics, Artificial Intelligence & Machine Learning, IoT & Sensors Analytics, Cloud Computing & Data Platforms), By Farm Type (Large Farms, Medium Farms, Small Farms), By Application (Crop Monitoring & Yield Prediction, Precision Agriculture, Risk & Pest Management, Supply Chain & Market Analytics) |
Key Agriculture Analytics Company Insights
Out on farms worldwide, technology shaped by IBM changes how crops are watched and cared for. Because it knows AI, huge sets of information, and online computer systems well, useful answers come faster now. Think about dirt quality, plant growth patterns, or gear running smoothly. Clarity shows up where there was guesswork. From one moment to the next, sensors talk to smart software that learns what each field needs. Predictions pop up before problems do, and suggestions arrive without being asked for twice. Machines keep an eye on things nonstop while choices get sharper every day. Less water, fewer seeds wasted, better timing, all possible because details matter more than ever. Across continents, teams link up with shared goals around smarter harvests. When knowledge flows freely between people and machines, fields respond differently. Progress hides not in loud steps but quiet shifts beneath the surface.
Key Agriculture Analytics Companies:
- Trimble Inc.
- IBM Corporation
- Wipro
- SAP SE
- Iteris
- Taranis
- Oracle Corporation
- Xylem Inc.
- Precision Hawk
- Gro Intelligence
- Granular
- John Deere
- Microsoft Corporation
- AGCO Corporation
- Arable Labs
- FarmLogs,
- AG Leader Technology
Global Agriculture Analytics Market Report Segmentation
By Component
- Software
- Services
By Technology
- Big Data Analytics
- Artificial Intelligence & Machine Learning
- IoT & Sensors Analytics
- Cloud Computing & Data Platforms
By Farm Type
- Large Farms
- Medium Farms
- Small Farms
By Application
- Crop Monitoring & Yield Prediction
- Precision Agriculture
- Risk & Pest Management
- Supply Chain & Market Analytics
Regional Outlook
- North America
- United States
- Canada
- Europe
- Germany
- United Kingdom
- France
- Spain
- Italy
- Rest of Europe
- Asia Pacific
- Japan
- China
- Australia & New Zealand
- South Korea
- India
- Rest of Asia Pacific
- Latin America
- Brazil
- Mexico
- Rest of Latin America
- Middle East & Africa
- GCC
- South Africa
- Rest of the Middle East & Africa
Frequently Asked Questions
Find quick answers to common questions.
The approximate Agriculture Analytics Market size for the market will be USD 4.47 billion in 2033.
Key segments for the Agriculture Analytics Market are By Component (Software, Services), By Technology(Big Data Analytics, Artificial Intelligence & Machine Learning, IoT & Sensors Analytics, Cloud Computing & Data Platforms), By Farm Type (Large Farms, Medium Farms, Small Farms), By Application (Crop Monitoring & Yield Prediction, Precision Agriculture, Risk & Pest Management, Supply Chain & Market Analytics).
Major Agriculture Analytics Market players are IBM Corporation, Taranis, SAP SE, and Microsoft Corporation.
The North America region is leading the Agriculture Analytics Market.
The Agriculture Analytics Market CAGR is 12.30%.
- Trimble Inc.
- IBM Corporation
- Wipro
- SAP SE
- Iteris
- Taranis
- Oracle Corporation
- Xylem Inc.
- Precision Hawk
- Gro Intelligence
- Granular
- John Deere
- Microsoft Corporation
- AGCO Corporation
- Arable Labs
- FarmLogs,
- AG Leader Technology
Recently Published Reports
-
Apr 2026
3D Optical Profiler Market
3D Optical Profiler Market Size, Share & Analysis Report By Type (Desktop 3D Optical Profiler, and Portable 3D Optical Profiler), By Technology (Confocal Technology, and White Light Interference), By End-Use Industry (Manufacturing, Research Institutions, Automotive, Aerospace and Defense, Medical Devices, and Other), and Geography (North America, Europe, Asia-Pacific, Middle East and Africa, South and Central America), 2021 - 2031
-
Apr 2026
Depth Sensor Market
Depth Sensor Market Size, Share & Analysis Report By Type (Infrared Depth Sensors, Time-of-Flight (ToF) Sensors, Stereo Vision Sensors, Structured Light Sensors, Ultrasonic Depth Sensors), By Application (Automotive, Robotics, Gaming, Consumer Electronics, Industrial Automation, Healthcare, Security & Surveillance, Others), By End Users (Automotive Manufacturers, Consumer Electronics Companies, Healthcare Providers, Industrial Companies, Security Agencies, Gaming Companies, Robotics Companies, Others), and Geography (North America, Europe, Asia-Pacific, Middle East and Africa, South and Central America), 2021 – 2031
-
Apr 2026
Digital Manufacturing Market
Digital Manufacturing Market Size, Share & Analysis Report By Component (Hardware, Software, and Services), By Technology (Robotics, 3D Printing, Internet of Things (IoT), and Others), By Application (Automotive and Transportation, Aerospace and Defense, Consumer Electronics, Industrial Machinery, and Others), By Process Type (Computer-Based Designing, Computer-Based Simulation, Computer 3D Visualization, Analytics, and Others), and Geography (North America, Europe, Asia-Pacific, Middle East and Africa, South and Central America), 2021 – 2031
-
Apr 2026
Digital Visa Services Market
Digital Visa Services Market Size, Share & Analysis Report By Type (Individual Travelers, Group Travelers), By Application (Tourism, Business Travel, Others), and Geography (North America, Europe, Asia-Pacific, Middle East and Africa, South and Central America), 2021 – 2031