
United Kingdom OTT Devices and Services Market Summary
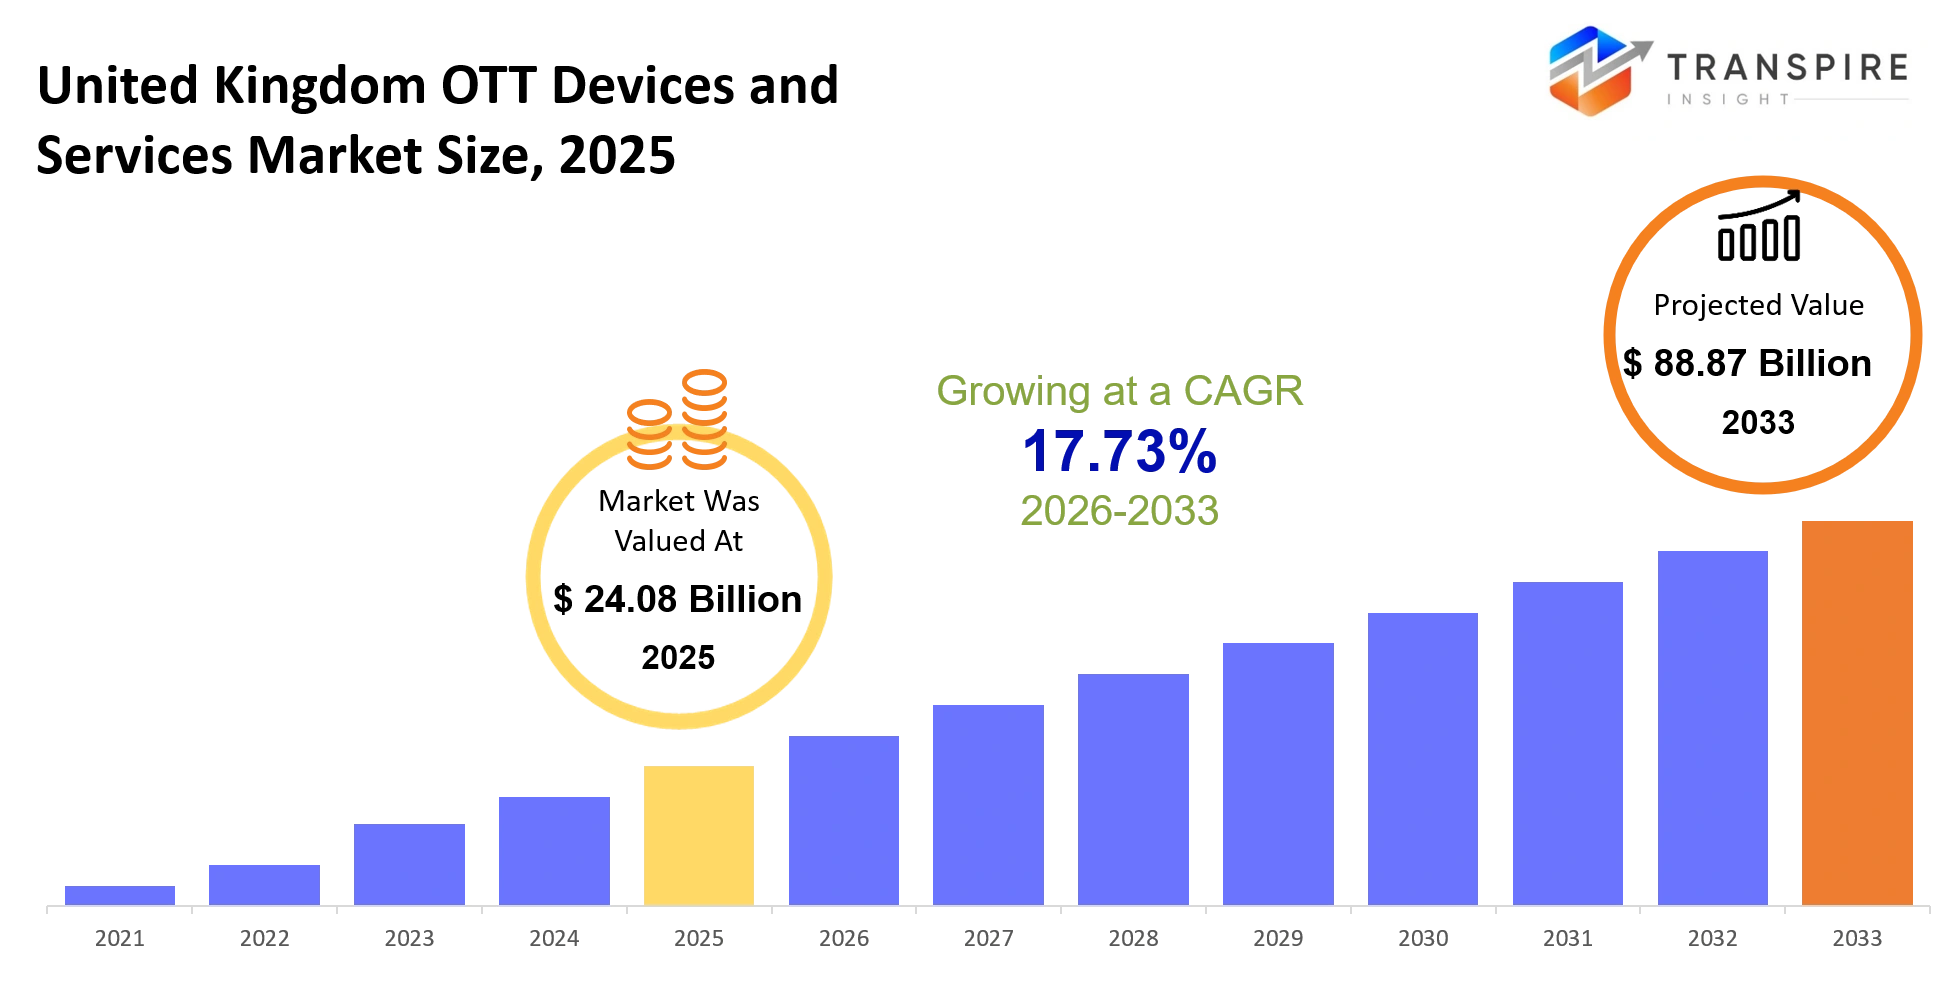
As per Transpire Insight Analysis the United Kingdom OTT Devices and Services Market size is estimated at USD 24.08 Billion in 2025 and is anticipated to reach USD 88.87 Billion by 2033, growing at a CAGR of 17.73% from 2026 to 2033.
The United Kingdom’s OTT devices and services market kinda lets households and businesses tap into video music gaming and live digital content, using internet-connected TVs streaming devices smartphones and other connected platforms. It kinda supports moving away from classic broadcast TV, because it gives folks more say about when, where, and how they watch the stuff. At the same time, it also helps content providers build up their audience, with subscription revenue, advertising income, and sometimes even mixed, or hybrid monetization arrangements that kinda blend together.In practice, this kind of flexibility has reworked how digital entertainment gets consumed across the UK.
In the last five years the market has been shifting in a more structural way, like slowly moving away from plain standalone streaming subscriptions, and more toward connected ecosystems that blend smart TVs , connected gadgets , cloud based services, and kinda bundled content offers. The COVID 19 pandemic also sped things up, by nudging viewing habits and making many users stick with digital consumption longer, than before, honestly. Meanwhile, as broadband infrastructure got better and more people started owning connected devices, service providers pushed harder into exclusive programming and personalized recommendation engines, plus advertising supported approaches that feel a bit more targeted. All of that has increased customer engagement, boosted platform stickiness, and opened more than one revenue stream beyond the old-school subscription-only route, so the market’s long-term growth looks more solid.
United Kingdom OTT Devices and Services Market Size & Forecast:
- United Kingdom OTT Devices and Services Market Size 2025: USD 24.08 Billion
- Expected Market Value 2033: USD 88.87 Billion
- Forecast CAGR: 17.73%
- Leading region in 2025: England
- Fastest Growing region: Scotland
- Key Profile: Netflix, Amazon Prime Video, Disney+, Apple TV+, Roku, Google, Samsung, LG Electronics, Sony, Microsoft, Spotify, BBC iPlayer, NOW, Paramount+, DAZN
Key Market Insights
- In 2024, England kind of dominated the market, with around 84% share, backed by better broadband take-up, more urban households. and those big, concentrated digital media investments, sort of kept feeding the growth.
- Scotland meanwhile, is projected to become the fastest-growing regional market in 2025–2032 , it’s pushed by fiber coverage that keeps expanding and smart home adoption that’s speeding up in a very noticeable way.
- For product and service, OTT services basically led the whole thing, grabbing close to 68% in 2024, mainly because subscription models, advertising- supported formats, and hybrid streaming approaches kept widening the way revenue came in.
- OTT devices stayed in the second spot, helped by the ongoing replacement of older television hardware, with connected streaming gadgets that people actually keep upgrading.
- Advertising-supported streaming services are forecast to show the quickest growth from 2025 to 2032, supported by price-conscious audiences, and advertisers moving their budgets toward digital video platforms more and more.
- As for the applications side, video streaming applications took the lead with about 72% market share in 2024, powered by premium entertainment, live sport, and exclusive original content .
- Cloud gaming, plus interactive streaming apps, is pretty much set to grow the most through 2032, largely because broadband keeps getting faster, and low-latency tech is helping the whole experience feel more seamless.
- From the end-user side, residential customers made up around 81% of the market in 2024. That kind of lines up with the fact that connected TV is now everywhere, and many households already lean on multi-device streaming rigs, you know.
- For commercial users—like hospitality, education, and healthcare—those folks are the fastest growing end-user segment, since organizations are still folding digital entertainment and communication services into normal, day-to-day workflows.
What are the Key Drivers, Restraints, and Opportunities in the United Kingdom OTT Devices and Services Market?
High speed fiber broadband deployment and pretty much everywhere smart television adoption are still the strongest growth catalyst, you know the type. Lower streaming latency, plus better viewing quality , pushed a lot of consumers to swap conventional tv services for internet based platforms. Also premium sports broadcasting, more exclusive local programming and those bundled subscription packages ended up speeding up the whole platform migration. These technology upgrades made engagement rise, kept recurring subscription revenue firmer, and opened up additional digital advertising inventory across the streaming ecosystem.
That said, the biggest structural roadblock still feels like content acquisition costs and fragmented licensing agreements, it’s kinda the same story. Premium sports rights and exclusive entertainment catalogs need multi year investments that smaller providers just can’t easily match. Platform fragmentation moreover adds to subscription fatigue, so users end up rotating between services , instead of just holding several subscriptions throughout the year. Based on a Transpire Insight review of regional procurement announcements and launch schedules, supply chain concentration is still the main execution risk. Those limitations end up dampening revenue expansion, pushing back new service launches, and lowering profitability for emerging platforms.
Artificial intelligence driven content discovery, cloud gaming, and addressable connected TV ads are basically where the best long-term chance sits. When providers put money into personalized recommendation engines and dynamic ad platforms, they can nudge user engagement up while also growing ad yield, not just “more eyeballs” but actual results. At the same time, the spread of 5G networks alongside nationwide fiber infrastructure gives the right conditions for ultra high definition streaming, interactive play , and premium digital services. Altogether, these shifts seem to set the stage for better monetization that goes beyond the usual subscription approach, like plain memberships only.
What Has the Impact of Artificial Intelligence Been on the United Kingdom OTT Devices and Services Market?
Artificial intelligence has kind of changed streaming platforms a lot, and it has also tied together different entertainment services, like, by automating recommendation engines, content moderation, ad placements, and even checking network performance in the background. Those advanced algorithms keep re assessing what people watch and how they watch it, so providers can tune home screens more closely, raise the streaming quality, and usually reduce buffering too, because traffic management gets smarter and a bit more careful overall. At the same time, automated compliance tools aid platforms in spotting restricted content, and handling regional licensing rules, in a more efficient way.
Now machine learning models are also used to predict viewing patterns, forecast subscriber churn, and measure advertising performance with better accuracy. With those predictive powers, streaming operators can plan where network resources go during big sports events and time original releases for maximum audience engagement. AI assisted encoding technologies, meanwhile, improve bandwidth efficiency while also lowering infrastructure costs. With better forecasting, viewer retention rises , ad conversion rates get stronger, and overall operations become more efficient across digital streaming ecosystems.
Still, even with these benefits, large scale AI deployment runs into real limitations. Pulling advanced analytics into older broadcasting systems, across multiple content libraries, takes serious spending and requires highly standardized data. Smaller providers often do not have enough historical datasets to train recommendation models properly, which then limits how accurate the personalization can be. On top of that, privacy regulations and shifting consumer expectations about data usage force constant updates , making implementation more complicated and pushing return on investment timelines out further.
Key Market Trends
- From 2023 to 2025 advertising-supported streaming services sort of picked up real momentum, pulling in cost conscious subscribers while also opening up digital ad revenue routes.
- By 2024, connected TV advertising budgets kept rising , so streaming providers started to invest in audience measurement and also programmatic advertising, not just the basics.
- AI powered recommendation engines became more or less standard across major platforms by 2024, which helped keep viewers around longer, and made personalized content discovery feel more “on the nose” .
- Then, smart television adoption went past 75% of UK households by 2024 , and kind of basically sped up direct-to-consumer streaming across a range of entertainment areas.
- Also, premium sports rights turned into a heavier competitive edge after 2022 , and that pushed exclusive agreements and subscriber acquisition plans that were more laser focused.
- In another direction cloud gaming integration sort of emerged quickly between 2024 and 2030 , extending OTT ecosystems beyond only traditional video entertainment stuff.
- Meanwhile the rollout of fiber broadband helped ultra high definition streaming run smoother , with lower latency . And that supported better engagement across connected households overall.
- More and more, leading providers bundled streaming with broadband and mobile services, and honestly this helped retention, while lowering subscriber acquisition costs, too.
- Finally, investment in localized UK original productions grew after 2023, reinforcing platform differentiation and improving long term subscriber loyalty .
United Kingdom OTT Devices and Services Market Segmentation
By Device Type :
Smart TVs take the biggest slice because they come with built-in streaming applications, faster internet connectivity, and display improvements that make digital entertainment feel a bit more effortless to reach. Retail is also pretty strong, plus there are regular product upgrades, so replacement demand keeps ticking along in most households . Streaming sticks still move steadily, they basically give a budget friendly route for older televisions that do not have integrated streaming features. Gaming consoles help too , since they blend entertainment and gaming in one place , which keeps people consuming content across the same setup.
Meanwhile, set-top boxes keep showing up for customers who want bundled TV and internet services, though the market share is still gradually tilting toward connected television platforms. Other connected devices fill more specific entertainment needs for different customer groups, like a sort of tailored approach. Product innovation, better wireless connectivity, and a broader menu of content keep influencing buying choices. And overall hardware upgrades, they tend to encourage longer viewing sessions while also supporting expanded services across connected ecosystems.
By Service Type :
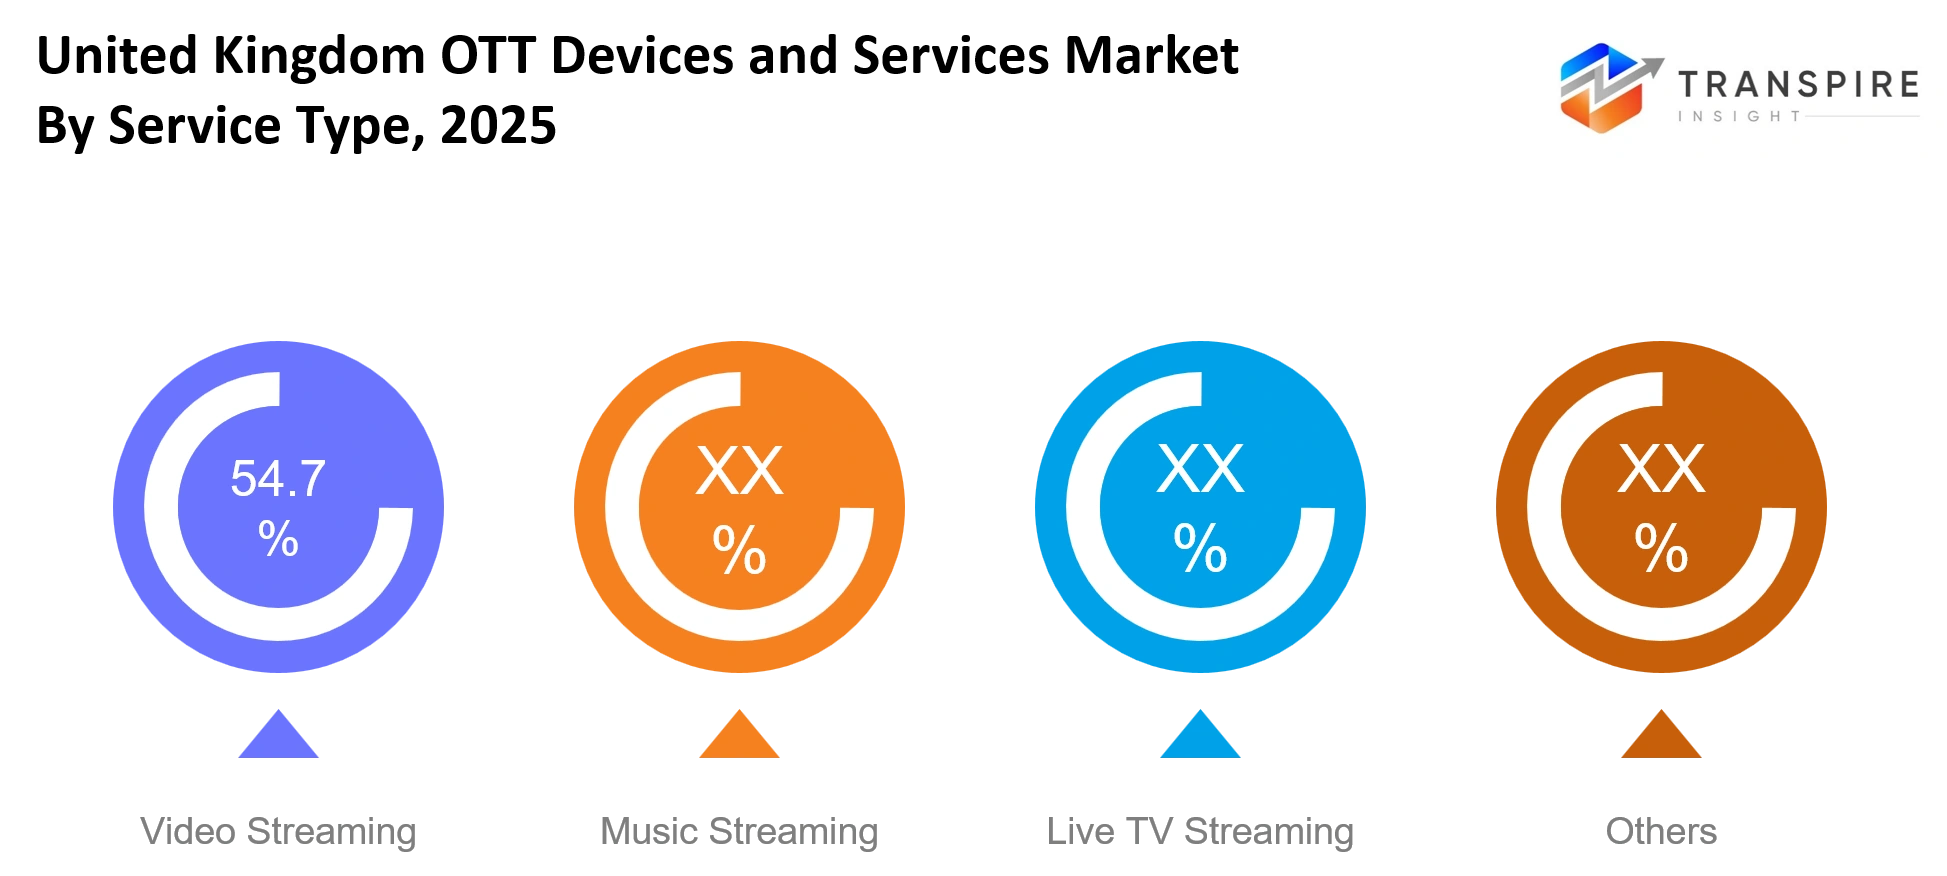
Video streaming pretty much leads the service segment, not just because it has exclusive original productions, but also due to premium sports content, and on demand viewing that brings in the biggest subscriber numbers. When investments go up for local productions and international content libraries, platforms get more competitive over all. Advertising supported subscriptions add another layer too, they open access for more customers, while also generating extra income. With more content variety showing up, the service keeps expanding, kinda steadier in the long run.
Music streaming keeps getting adopted at a steady pace, mostly through personalized playlists, podcasts, and bundled digital subscriptions that feel more convenient. Live tv streaming meanwhile grows pretty well, since people want flexible access to sports, news, and entertainment, without the usual TV contract drama. The other digital streaming services are still expanding as well, across education and more niche content, pretty much in a steady push. Platform upgrades and better broadband coverage help overall usage, so the whole thing sticks longer.
By Revenue Model :
Subscription still kinda stays the main revenue model, because a predictable loop of income helps fund exclusive content creation, and also the longer-term platform investments it needs. Premium memberships keep pulling in customers who want uninterrupted watching, plus access to broader content collections. Multi device access, and these bundled subscription packages really do help keep customers around for longer. When revenue stays stable on a recurring basis, platforms can keep putting money into better technology and original programming, basically without that constant scramble.
At the same time, ad-supported platforms keep growing since brands are moving their marketing budgets toward connected television audiences. The freemium approach pulls in first time users, then later those same users convert into paid subscriptions, usually via premium features and more exclusive content. Other revenue streams, besides the big subscription part, include transactional purchases and event based digital access. Flexible pricing strategies also matter here, they expand reach across different income groups and kinds of viewers.
By End User :
Residential users take up the biggest market share, because connected televisions , smartphones, tablets, plus broadband services enable everyday digital entertainment consumption. Family viewing habits along with personalized streaming preferences keep nudging household subscriptions forward. Also the smart home adoption factor helps deepen usage across a bunch of connected devices. Ongoing platform enhancements in turn support customer engagement and help keep people around longer.
On the commercial side, adoption keeps growing across hotels, healthcare facilities, educational institutions, and corporate environments where digital entertainment along with communication services are part of the routine. Company investment in connected displays makes it easier to slot in streaming more widely, and with less friction. There are also other end-user groups that continue picking up digital content platforms for niche, more specialized applications. Meanwhile infrastructure improvements keep creating fresh commercial deployment opportunities.
By Platform :
Android TV seems to drive platform adoption via broad manufacturer partnerships and flexible application support, plus it’s just broadly available across multiple television brands. The wide product selection makes it easier to reach people in lots of price bands. Also those continuous software updates help with user experience and keep app compatibility in a better place, not just right now. There is also strong ecosystem integration which helps longer term platform growth, even when things shift.
Fire TV and Apple TV stay in a strong position mainly because of premium user experiences, voice guided navigation, and connected home integration. Meanwhile Roku keeps pushing forward with advertising technology and simpler streaming interfaces, so people get in faster. The other operating platforms cover selected consumer needs too, depending on the hardware manufacturers. And the competition between these platforms, basically nudges regular software enhancements and wider content availability overall.
By Content Type :
Movies and television series somehow manage the highest viewing engagement, mostly because those exclusive releases, original productions, and very large content libraries keep people watching for a long time. The premium entertainment side still pulls a lot of weight, it keeps subscription retention strong across major streaming providers, and there’s this sense it never really slows down. Sports content too seems to boost audience engagement through live broadcasting rights, plus seasonal events that bring viewers back again and again. And honestly, diverse programming broadens platform appeal, like across different age groups which matters more than it sounds.
Music content holds steady digital consumption, mainly through live performances, concerts, and artist centered programming that’s easy to find on streaming platforms. Other categories, like documentaries, kids programming, educational material, and lifestyle related content, are still expanding audience reach. More investment in localized productions, also helps customer engagement across regional audiences in a noticeable way. When platforms build broader content portfolios, they often get better long term revenue potential and stronger competitiveness, even later on.
What are the Key Use Cases Driving the United Kingdom OTT Devices and Services Market?
The biggest use case comes from household video streaming, where connected TVs and paid subscription platforms sorta deliver movies, television series, and even live sports. In broadband enabled homes, families, and standalone subscribers tend to spend the most, mainly because nonstop access to premium and exclusive material keeps people watching longer and sticking to recurring digital subscriptions, you know.
Commercial streaming keeps growing too, especially across hotels, healthcare settings, and schools or other educational institutions. Hospitality teams lean on connected entertainment services to raise guest satisfaction, while education providers offer on demand learning resources through internet based platforms. Even live TV streaming helps public venues show sports and major events.
Cloud gaming, plus interactive streaming, is another set of applications that looks newish but has strong long term potential. Retail companies are also testing branded streaming channels to boost customer engagement and sharpen digital marketing efforts. By the way, broader adoption over the forecast period should get a push from 5G rollouts, AI powered personalization and more advanced connected television technology, all at once.
|
Report Metrics |
Details |
|
Market size value in 2025 |
USD 24.08 Billion |
|
Market size value in 2026 |
USD 28.35 Billion |
|
Revenue forecast in 2033 |
USD 88.87 Billion |
|
Growth rate |
CAGR of 17.73% from 2026 to 2033 |
|
Base year |
2025 |
|
Historical data |
2021 - 2024 |
|
Forecast period |
2026 - 2033 |
|
Report coverage |
Revenue forecast, competitive landscape, growth factors, and trends |
|
Regional scope |
United Kingdom (England, Scotland, Wales, Northern Ireland) |
|
Key company profiled |
Netflix, Amazon Prime Video, Disney+, Apple TV+, Roku, Google, Samsung, LG Electronics, Sony, Microsoft, Spotify, BBC iPlayer, NOW, Paramount+, DAZN . |
|
Customization scope |
Free report customization (country, regional & segment scope). Avail customized purchase options to meet your exact research needs. |
|
Report Segmentation |
By Device Type (Streaming Sticks, Smart TVs, Set-Top Boxes, Gaming Consoles, Others); By Service Type (Video Streaming, Music Streaming, Live TV Streaming, Others); By Revenue Model (Subscription, Advertisement, Freemium, Others); By End User (Residential, Commercial, Others); By Platform (Android TV, Roku, Apple TV, Fire TV, Others); By Content Type (Movies, Sports, Series, Music, Others) |
Which Regions are Driving the United Kingdom OTT Devices and Services Market Growth?
England is, like, roughly 84% of market revenue, so that makes it the biggest piece of the overall industry picture. With a lot of full fiber broadband rolling out,plus advanced 5G coverage and a decent set of digital infrastructure programmes, things look pretty good for connected entertainment services. Big content providers, technology firms, cloud infrastructure operators, and advertising networks keep solid operations across London, and also in other big city areas. And if they keep putting money into network upgrades,premium content creation, and connected television ecosystems, then England should stay in the lead for most of the forecast period.
Scotland then comes in as the second-largest regional contributor, mostly because digital infrastructure growth takes a kind of steady approach, spread across towns and countryside at the same time, not just one concentrated lane. There’s also stable public spending on broadband connectivity,and ongoing regulatory backing, which helps streaming services and connected devices roll out in a reliable way. Household adoption keeps going, supported by resilient consumer budgets and wider access to high-speed internet rather than a sudden jump from population clustering. Because of these structural features, the subscription income looks more dependable and there are regular commercial chances across hospitality, education, and public service work too.
Wales is expected to see the most rapid growth during the 2026–2033 stretch, kind of thanks to the broader fiber broadband rollout, and also the ongoing investment in digital connectivity programs. With better network availability, more people can reach high-quality streaming services across areas that, before, had pretty serious limitations around connection. The growth is also helped by higher take-up of connected televisions, plus the rise of cloud based entertainment platforms for both home users and commercial customers. This whole momentum should open up solid and rather enticing opportunities for platform providers, device manufacturers, digital advertisers, and content distributors looking for expansion over the forecast period.
Who are the Key Players in the United Kingdom OTT Devices and Services Market and How Do They Compete?
Competition across the United Kingdom OTT devices and services market is still fairly consolidated, since only a handful of global streaming platforms and connected device makers take up a big slice of digital viewing. On the ground, the main “battle points” are technology innovation, exclusive catalogues, platform integration, and also flexible service approaches that feel adaptable. Older providers keep pushing retention by growing their broader ecosystem , while newer entrants try to stand out with ad-supported packages, smaller but targeted content libraries, and more specialized streaming journeys.
Netflix stays distinctive via original productions, sophisticated recommendation technology, and ongoing spending into advertising-supported subscriptions, which helps broaden customer reach. Amazon Prime Video ties together streaming with a broader digital membership bundle, and leans on exclusive sports coverage plus original titles to keep subscribers from drifting away. Disney+ builds its edge through family oriented entertainment, premium franchises, and locally produced content that supports longer term subscriber momentum.
Roku centers on connected television software, advertising technology, and straightforward user experiences, basically, so engagement holds across different hardware brands. Samsung Electronics boosts smart TV abilities using AI enabled features, smooth app integration, and steady software updates that help streaming perform more smoothly. With continued investment in platform features, partnerships that matter, and content ecosystems, these firms can reinforce customer loyalty while also opening up extra revenue chances across connected entertainment services.
Company List
- Netflix
- Amazon Prime Video
- Disney+
- Apple TV+
- Roku
- Samsung
- LG Electronics
- Sony
- Microsoft
- Spotify
- BBC iPlayer
- NOW
- Paramount+
- DAZN
Recent Development News
In February 2026, Sky and Disney announced an expanded multi-year agreement to include Disney+ in eligible Sky TV subscriptions across the UK and Ireland. The partnership strengthens OTT distribution by integrating Disney+ more deeply with Sky OS and expanding streaming access to millions of additional households. Sourcehttps://press.disney.co.uk/
In January 2026, Samsung Electronics announced that Samsung TV Plus had surpassed 100 million monthly active users globally and expanded the service with more than 4,300 free streaming channels across supported devices. The investment reinforces the growth of free ad-supported streaming services and strengthens Samsung's connected TV ecosystem, including the UK market. Source https://news.samsung.com/
What Strategic Insights Define the Future of the United Kingdom OTT Devices and Services Market?
Over the next five to seven years, the market will slowly drift toward more fully integrated digital entertainment ecosystems that kind of glue together connected devices, cloud infrastructure, artificial intelligence, advertising technology, and premium content , all inside unified platforms. The push behind this will be helped by stronger fiber connectivity, wider adoption of connected televisions, and the rising use of data-driven content delivery, which in turn makes monetization work better than subscription revenue alone. There is also a less visible risk, from this growing dependence on just a handful of global platform operators and cloud infrastructure providers. That kind of market concentration can end up squeezing competition and it may raise operational exposure if regulatory requirements change, or get tightened, later on.
At the same time, an important emerging opportunity is showing up in interactive streaming, cloud gaming, and AI-powered personalized advertising, especially as network capacity keeps improving in underserved areas. In practice, market participants will benefit most by building scalable platform partnerships, funding localized premium content, and enhancing their advanced advertising capabilities, rather than counting only on subscriber growth for future revenue expansion.
United Kingdom OTT Devices and Services Market Report Segmentation
By Device Type
- Streaming Sticks
- Smart TVs
- Set-Top Boxes
- Gaming Consoles
By Service Type
- Video Streaming
- Music Streaming
- Live TV Streaming
By Revenue Model
- Subscription
- Advertisement
- Freemium
By End User
- Residential
- Commercial
By Platform
- Android TV
- Roku
- Apple TV
- Fire TV
By Content Type
- Movies
- Sports
- Series
- Music
Frequently Asked Questions
Find quick answers to common questions.
The expected United Kingdom OTT Devices and Services Market size for the market will be USD 88.87 Billion in 2033.
Key segments for the United Kingdom OTT Devices and Services Market are By Device Type (Streaming Sticks, Smart TVs, Set-Top Boxes, Gaming Consoles, Others); By Service Type (Video Streaming, Music Streaming, Live TV Streaming, Others); By Revenue Model (Subscription, Advertisement, Freemium, Others); By End User (Residential, Commercial, Others); By Platform (Android TV, Roku, Apple TV, Fire TV, Others); By Content Type (Movies, Sports, Series, Music, Others).
Major United Kingdom OTT Devices and Services Market players are Netflix, Amazon Prime Video, Disney+, Apple TV+, Roku, Google, Samsung, LG Electronics, Sony, Microsoft, Spotify, BBC iPlayer, NOW, Paramount+, DAZN.
The United Kingdom OTT Devices and Services Market size is USD 24.08 Billion in 2025.
The United Kingdom OTT Devices and Services Market CAGR is 17.73% from 2026 to 2033.
- Netflix
- Amazon Prime Video
- Disney+
- Apple TV+
- Roku
- Samsung
- LG Electronics
- Sony
- Microsoft
- Spotify
- BBC iPlayer
- NOW
- Paramount+
- DAZN
About the Authors

Mayur Shinde
I am Mayur Shinde, a Senior Research Analyst at Transpire Insight, specializing in the Automotive & Transportation and Information & Communication Technology (ICT) Industry. My work focuses on analyzing emerging market trends, technological advancements, competitive landscapes, and industry developments to deliver accurate, data-driven insights. I am passionate about transforming complex market information into clear, actionable content that helps businesses, professionals, and decision-makers stay informed and make confident strategic decisions.

Chakradhar Khansole
Chakradhar serves as the Research Director at Transpire Insight, bringing over 8 years of experience in technology, innovation, and strategic market intelligence. He specializes in transforming complex market data into actionable business insights that enable organizations to make informed, growth-oriented decisions. Recognized for his strategic vision and analytical expertise, Chakradhar leads high-impact research initiatives, delivering comprehensive market assessments, competitive intelligence, and forward-looking industry analysis.
Recently Published Reports
-
Apr 2026
3D Optical Profiler Market
3D Optical Profiler Market Size, Share & Analysis Report By Type (Desktop 3D Optical Profiler, and Portable 3D Optical Profiler), By Technology (Confocal Technology, and White Light Interference), By End-Use Industry (Manufacturing, Research Institutions, Automotive, Aerospace and Defense, Medical Devices, and Other), and Geography (North America, Europe, Asia-Pacific, Middle East and Africa, South and Central America), 2021 - 2031
-
Apr 2026
Depth Sensor Market
Depth Sensor Market Size, Share & Analysis Report By Type (Infrared Depth Sensors, Time-of-Flight (ToF) Sensors, Stereo Vision Sensors, Structured Light Sensors, Ultrasonic Depth Sensors), By Application (Automotive, Robotics, Gaming, Consumer Electronics, Industrial Automation, Healthcare, Security & Surveillance, Others), By End Users (Automotive Manufacturers, Consumer Electronics Companies, Healthcare Providers, Industrial Companies, Security Agencies, Gaming Companies, Robotics Companies, Others), and Geography (North America, Europe, Asia-Pacific, Middle East and Africa, South and Central America), 2021 – 2031
-
Apr 2026
Digital Manufacturing Market
Digital Manufacturing Market Size, Share & Analysis Report By Component (Hardware, Software, and Services), By Technology (Robotics, 3D Printing, Internet of Things (IoT), and Others), By Application (Automotive and Transportation, Aerospace and Defense, Consumer Electronics, Industrial Machinery, and Others), By Process Type (Computer-Based Designing, Computer-Based Simulation, Computer 3D Visualization, Analytics, and Others), and Geography (North America, Europe, Asia-Pacific, Middle East and Africa, South and Central America), 2021 – 2031
-
Apr 2026
Digital Visa Services Market
Digital Visa Services Market Size, Share & Analysis Report By Type (Individual Travelers, Group Travelers), By Application (Tourism, Business Travel, Others), and Geography (North America, Europe, Asia-Pacific, Middle East and Africa, South and Central America), 2021 – 2031